Shelly Cheng will deliver a panel talk at #Outlier2025:
“Navigating a Career as a Data Visualization Engineer”
Register here: https://t.co/jR6TvVyBx3
#dataviz#datavisualization
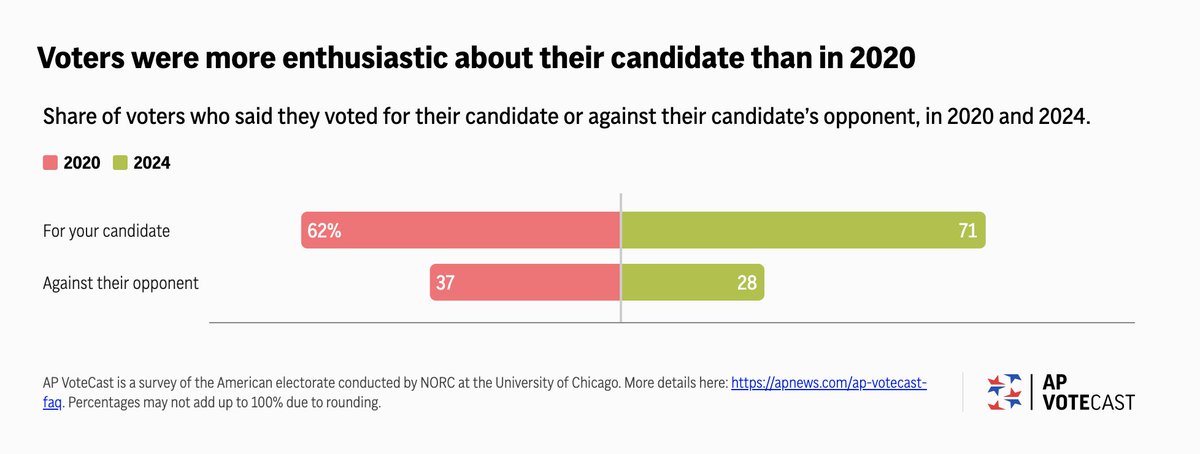
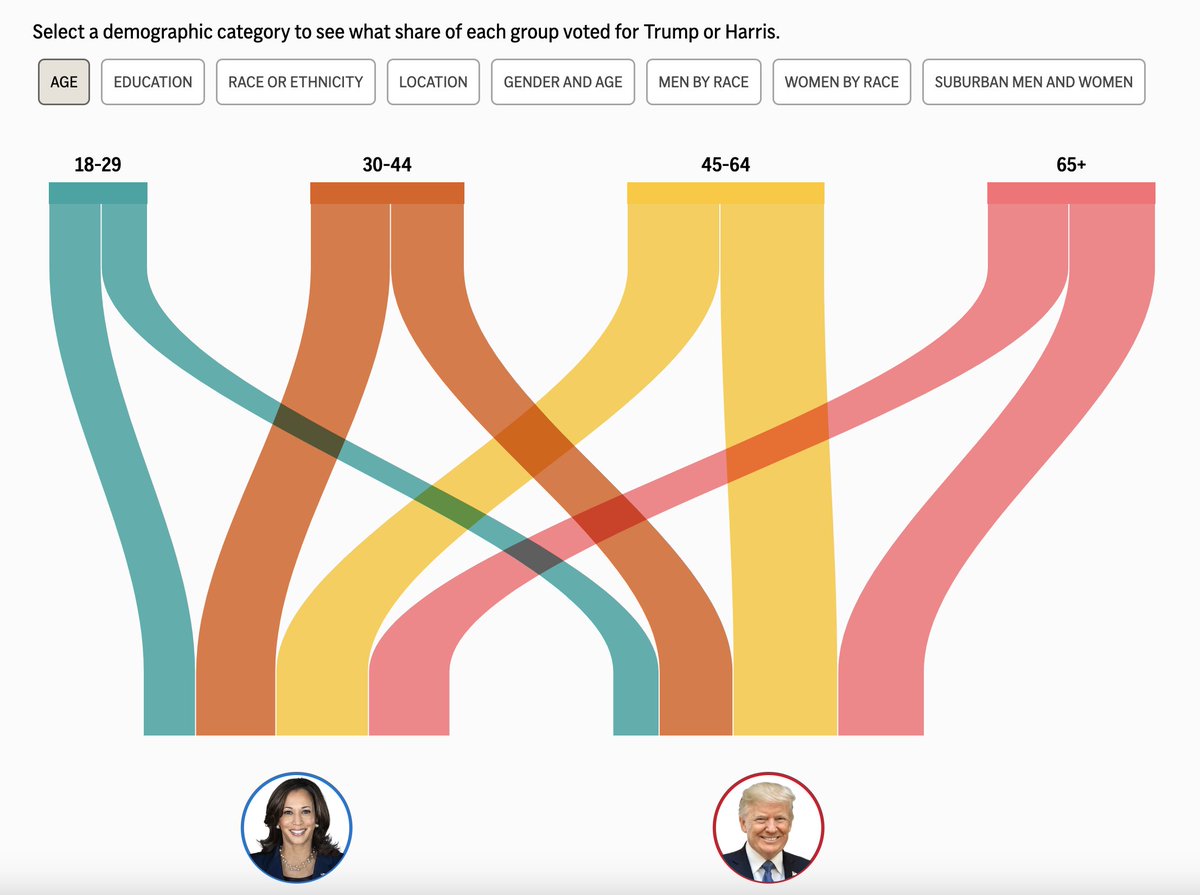
In addition, AP VoteCast interviewed more than 120,000 voters across the U.S. from October 28 to November 5 this year, continuing until poll close. Now 2024 VoteCast result is now live at https://t.co/9Fv7NWrqwT
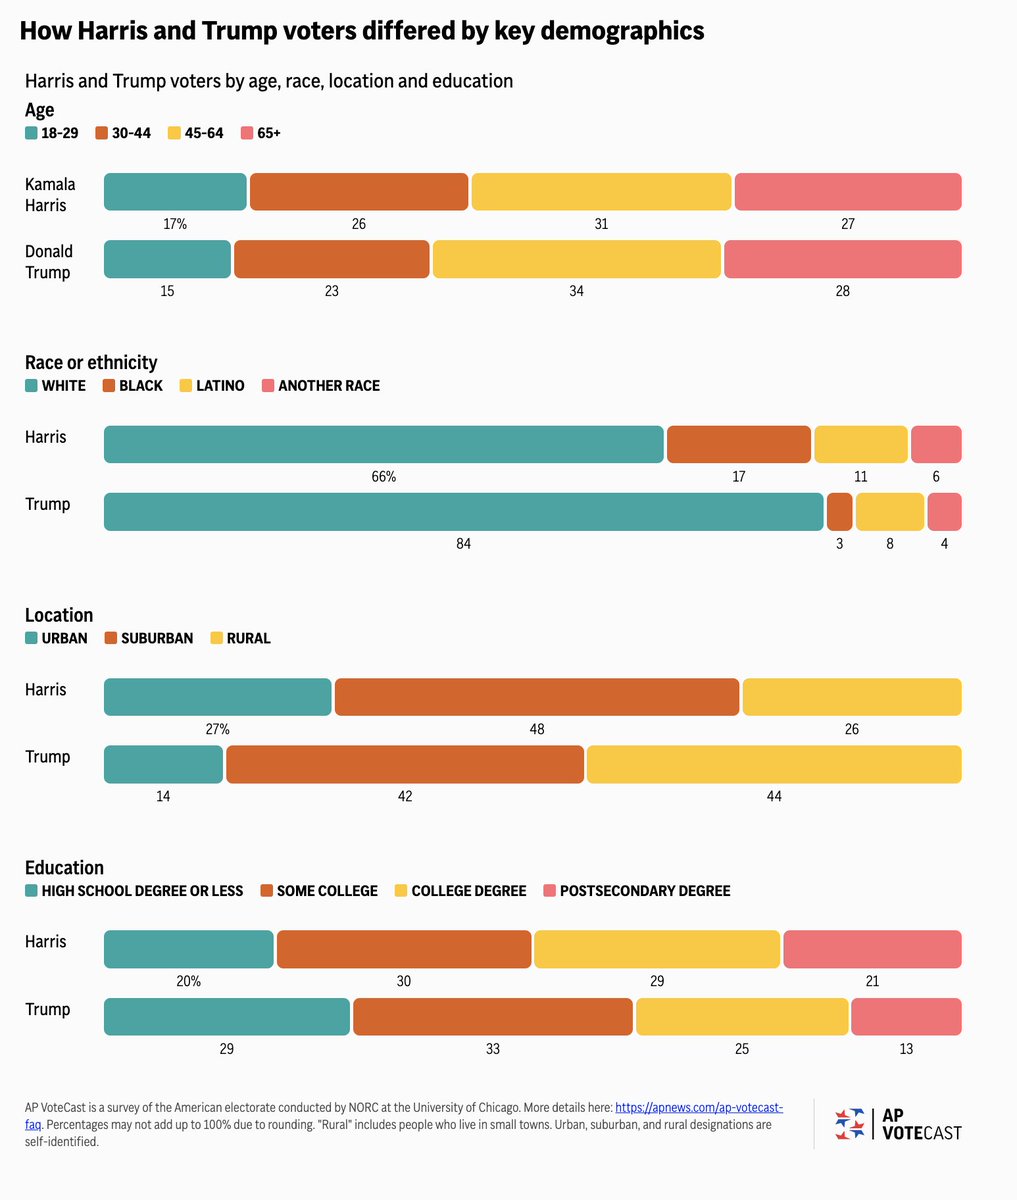
🧵 My latest work for @AP dives into #APVotecast 2020 data, a comprehensive survey capturing the opinions and demographics of American voters. As we approach #Election2024, let’s explore key voter dynamics across age, race, location, education and etc. 📊 https://t.co/5r5RCfnAwq
5️⃣ Top Issues: In 2020, COVID-19 and the economy dominated voter concerns. With new challenges in 2024, it’ll be interesting to see which issues resonate most.
Stay tuned for live updates on 11/5 from the 2024 #APVotecast! #DataViz#Journalism#Elections
This shift made our election coverage directly accessible to millions of readers, bringing an unprecedented level of transparency and immediacy to election updates.
Together, we created an interactive and reliable source that keeps reader informed during this pivotal time💻📊📈
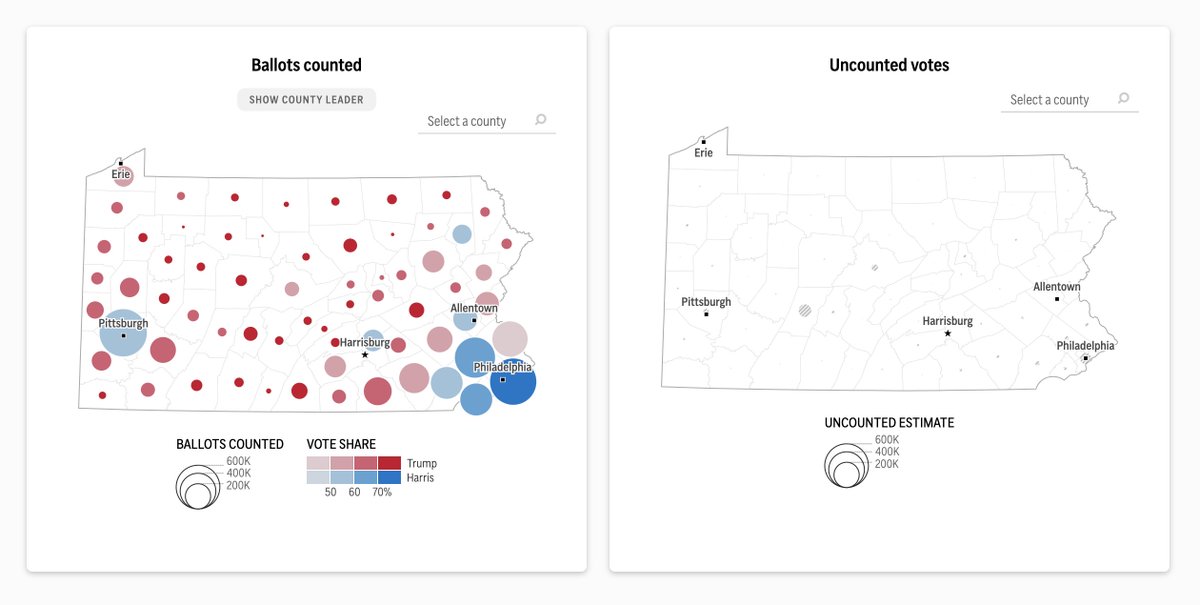
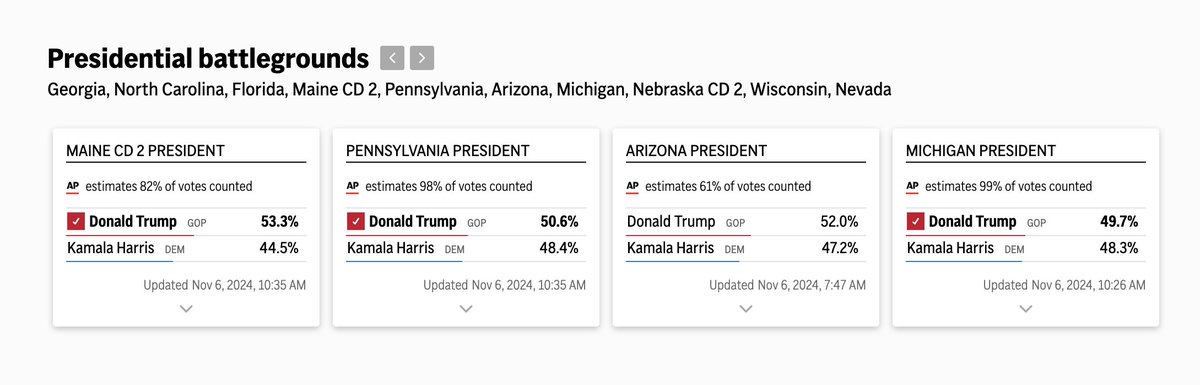
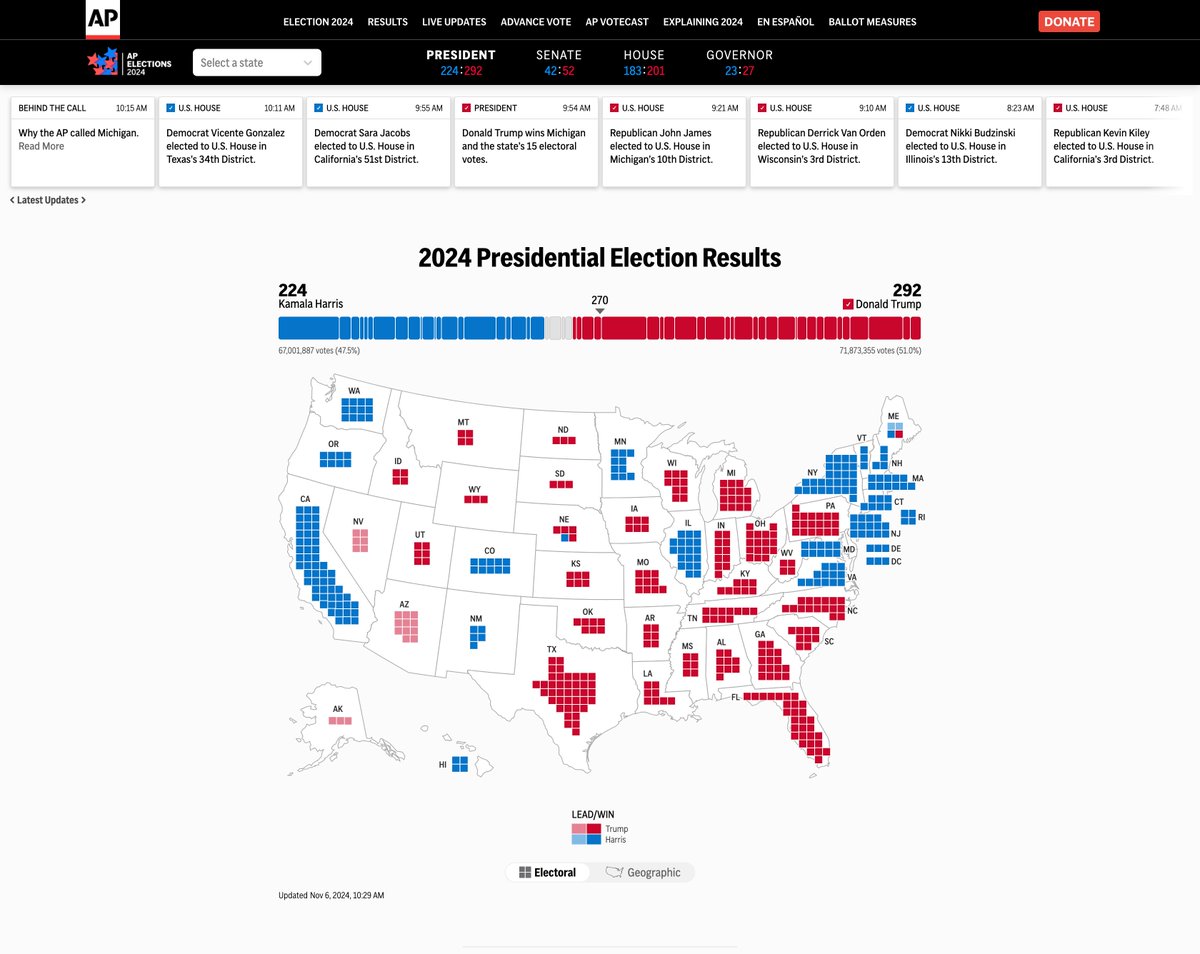
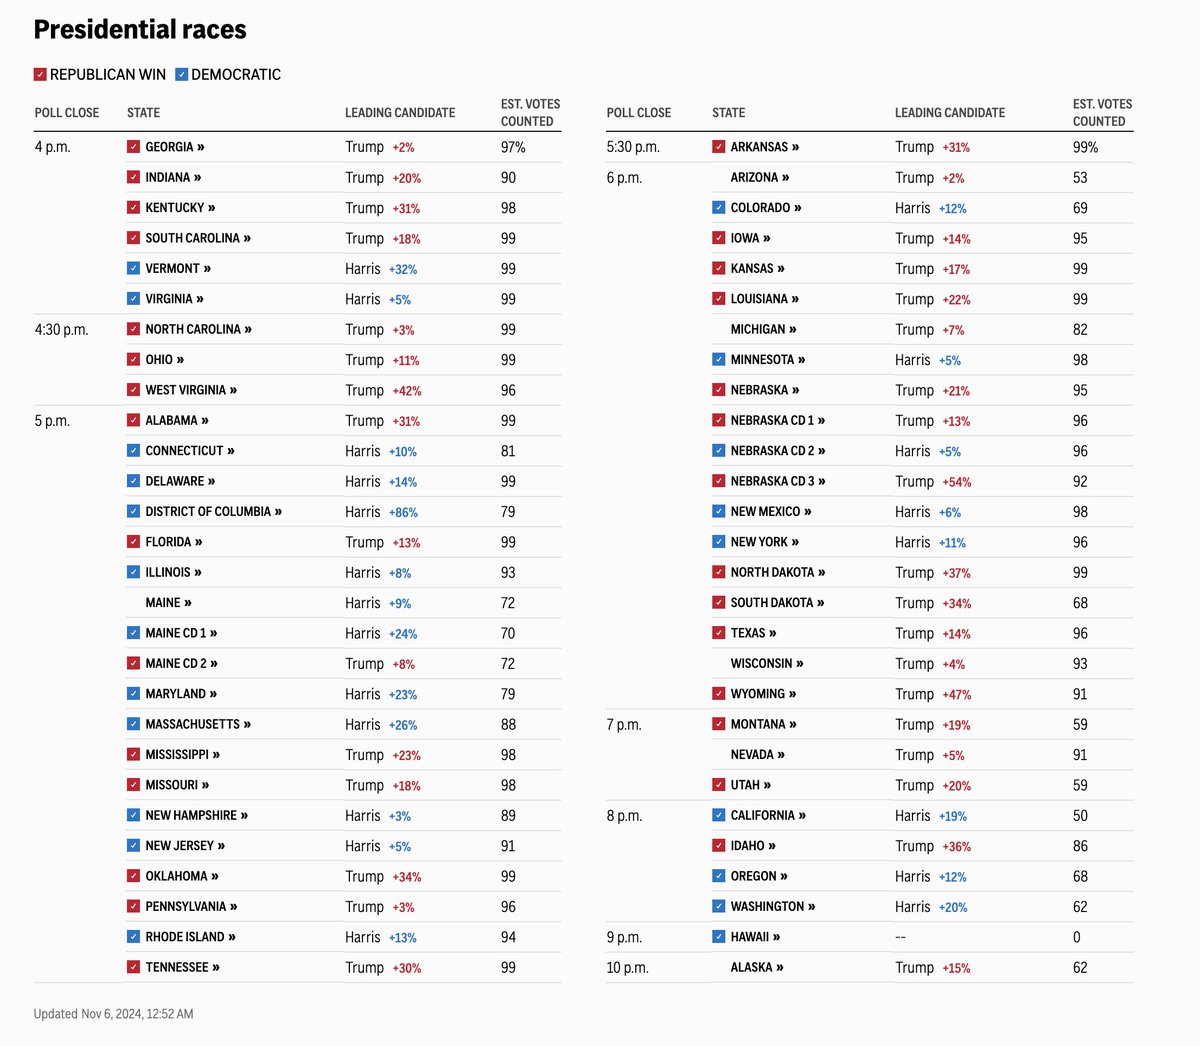
As the election season wraps up, I couldn’t be prouder of the results page that we've built over the past year at @AP: https://t.co/upVT8I9dN0 This project took dedication, precision, and teamwork, and I’m incredibly grateful to work alongside some of the best in the industry🙌✨
This year was a milestone. AP has called election winners since 1848, and for the first time, we brought our election visualizations directly to the public on https://t.co/7ko5b25OZj—previously only available to clients like @Yahoo and other newsrooms: https://t.co/upVT8I9dN0
Join us for our hackathon, Hack for Social Impact, on Nov. 9th and 10th in SF!
We're partnering with organizations including the United Nations Convention to Combat Desertification and the Chan Zuckerberg Initiative for a weekend of impact-driven building.
🧵
Proud to have worked with @marianliu, @celiawu, Brian Cleveland, and @audrey_valbuena on building the new website for the style guide! Check it out at https://t.co/gdrGyjQ0M9
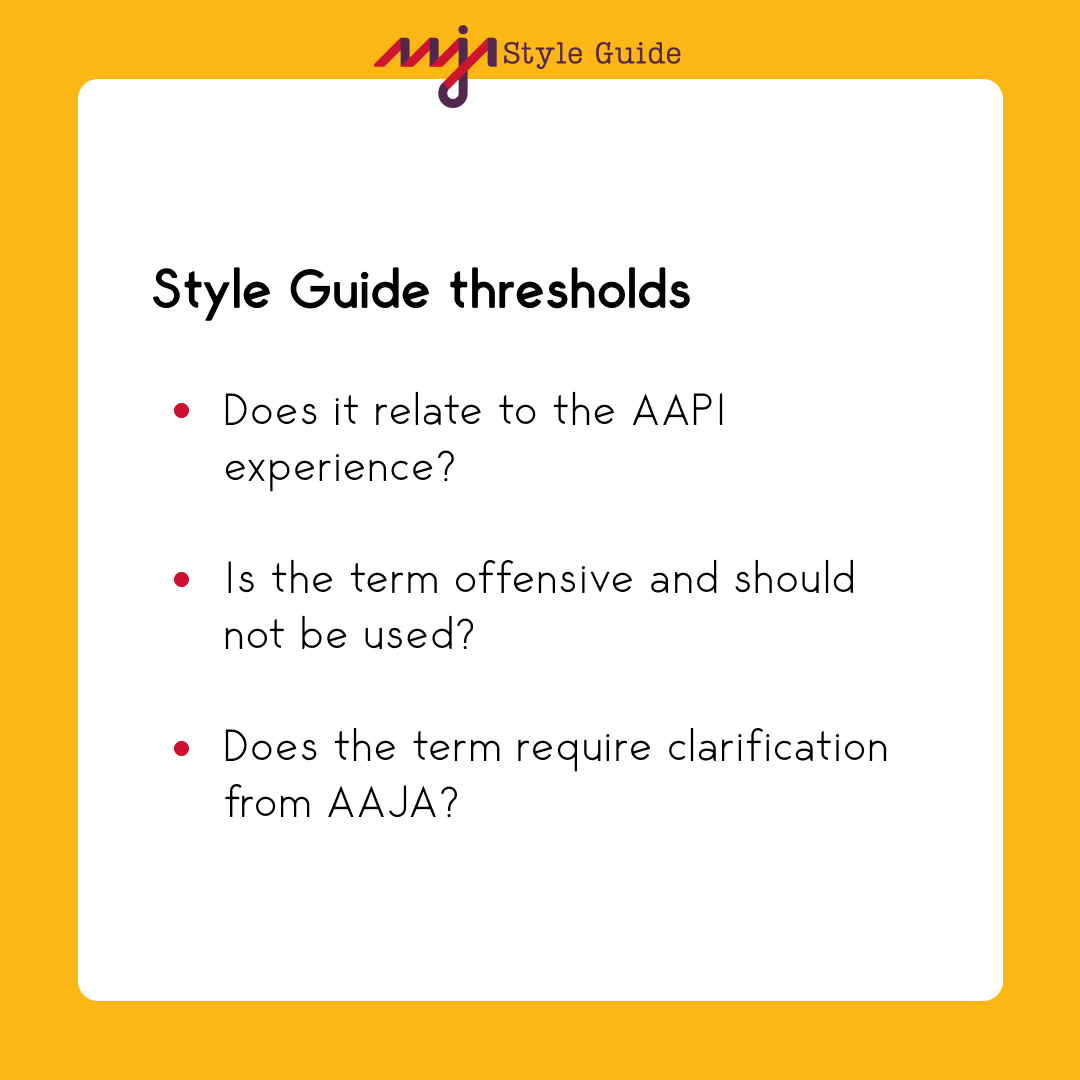
AAJA is proud to announce our revised Style Guide! This guide is meant for anyone who wants to better understand and more responsibly cover Asian American Pacific Islander communities. Learn more at https://t.co/TQ7xUhVybW
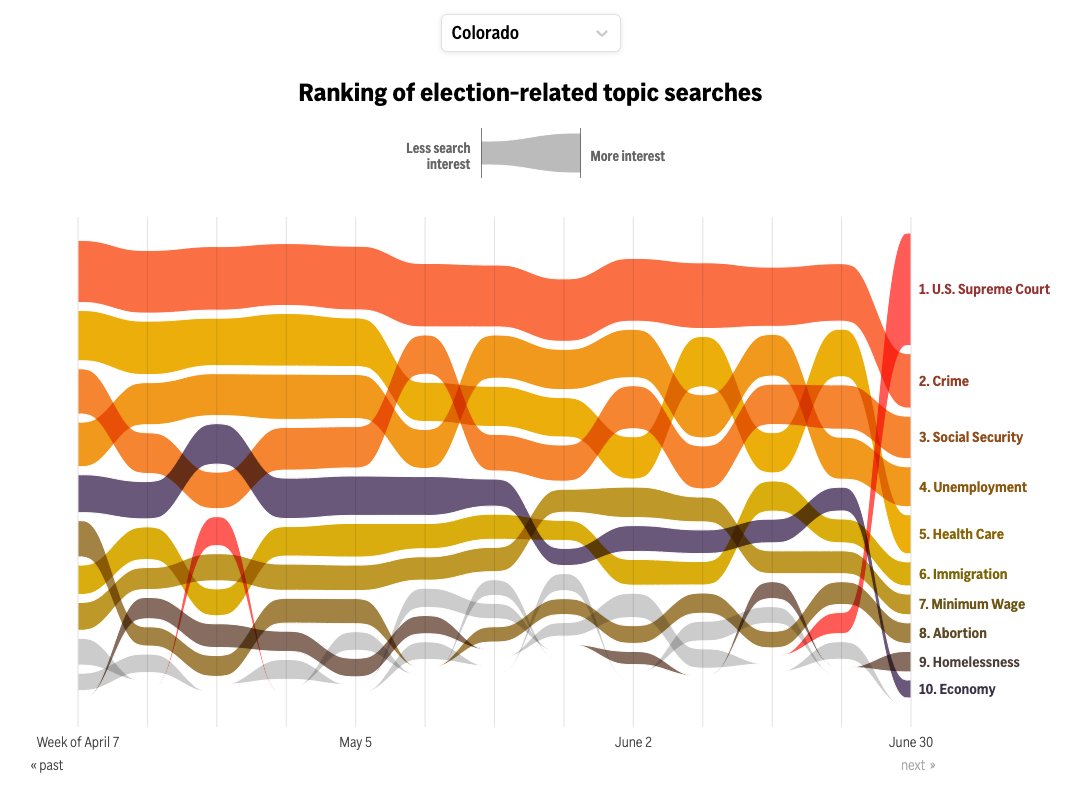
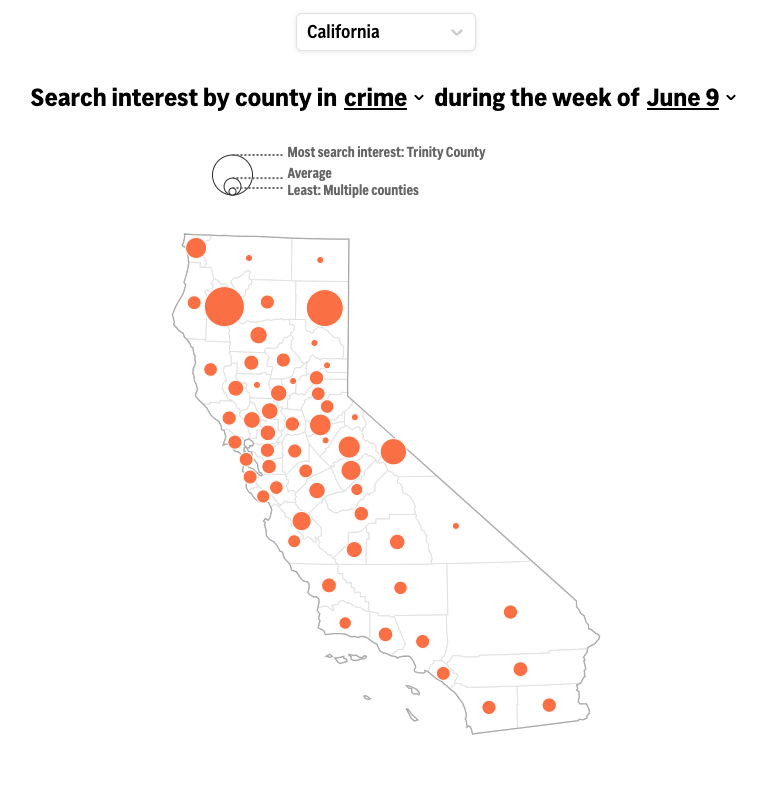
There's also a dropdown at the top to switch state selection, and the map also allows you to dig deeper into state-level and county-level data across time. Explore today how different states are engaging with different election issues. 🗺️📊 #Election2024 https://t.co/ghp4OMiw3S
📢📊Excited to share my latest work with @AP and @GoogleTrends. I led the visualization of what Americans are searching for about the 2024 election: crime, healthcare, and more. The data updates weekly, showing trending topics nationwide and in every state https://t.co/ghp4OMiw3S
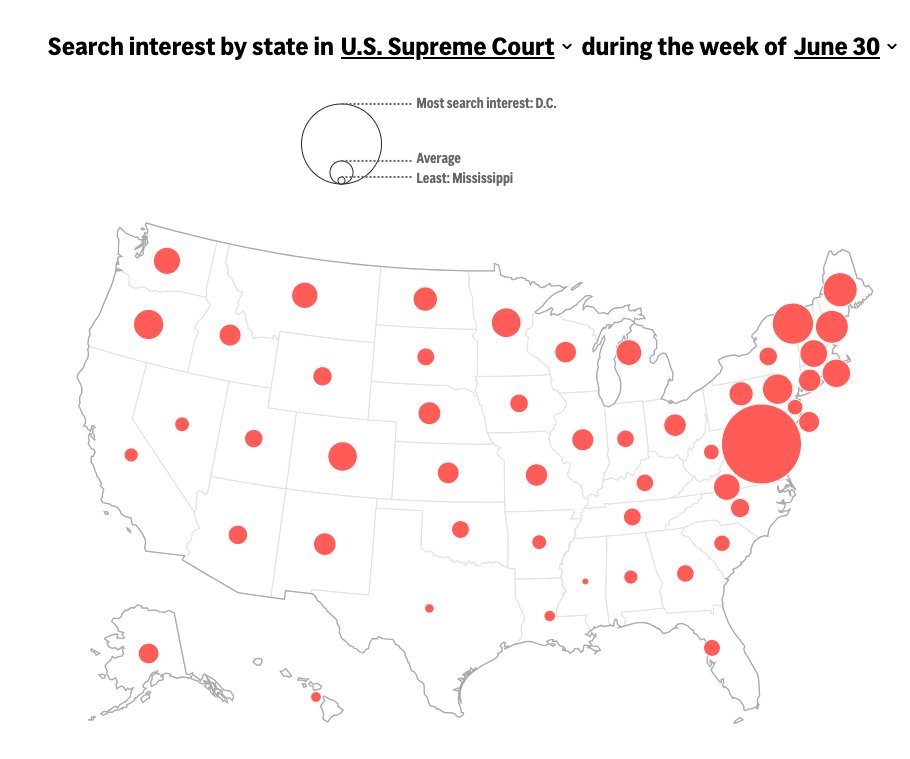
🔍 Where is the interest in the U.S. Supreme Court highest? Our national map shows search interest by state for the week of June 30. D.C. tops the list, while Mississippi shows the least interest.