🚨 Yesterday I wrote that all four historic market risks – inflation, liquidity, tech, credit – are simultaneously present for the first time in 50 years.
Today let's zoom out further. Way out.
This chart shows 225 years of US stock prices, inflation-adjusted. It reveals something most modern investors have never seen, because the data simply isn't long enough in our living memory.
Roughly every 60 years, the market completes a full secular cycle:
– 1802 → 1857: 50-year rise, ended with US secession war and 5 years down
– 1857 → 1920: 63-year cycle, ended with WWI, post-war inflation and 11 years down
– 1920 → 1981: 61-year cycle, ended with oil shocks, Vietnam, stagflation and 13 years down
– 1981 → ?: the current cycle
If the pattern holds, the next secular top arrives around 2028. Followed by a 10-15 year inflation-driven drawdown that bottoms somewhere between 2039 and 2043.
The recipe is always the same
Each secular ending has three ingredients:
1. Persistent inflation
2. Geopolitical conflict (war, deglobalization, empire transition)
3. A speculative melt-up in the dominant sector of the era
The 1850s had railroads.
The 1910s had electrification and trusts.
The 1970s had the Nifty Fifty.
The 2020s have AI.
We're already two of three in 2026. Inflation has returned. Deglobalization is accelerating. The AI melt-up is the missing piece, and it's underway.
Why this matters
The playbook that worked from 1981 to today was defined by one regime: falling rates, globalization, passive flows, US tech dominance.
That regime ends with every 60-year cycle. Historically, the next decade rewards a completely different set of assets.
What worked in the cycle just ending:
– Long-duration growth
– Passive index investing
– US large-cap concentration
– Tech
What has worked through every secular transition since 1800:
– Cash-flowing businesses with pricing power
– Real assets and infrastructure
– Defensive, durable, boring
– Active stock selection
The uncomfortable part
Every cycle felt unique to the people living through it.
The 1920s investor was certain the new technologies of his age were different from the railroads of 1857.
The 1968 investor was certain stagflation couldn't happen in the modern economy.
They were all wrong in the same way.
If we're somewhere near the top of cycle four, the quality stocks being mocked today aren't dead money.
They're early.
🚨Michael Burry just said Elon Musk and Nvidia's deal is built on fake numbers.
Burry published a detailed breakdown calling the entire structure "Fugazi", his word for fake.
He is alleging that billions of dollars in Nvidia chips are being hidden off balance sheets, and that American retirees are unknowingly funding the whole thing.
Nvidia, the world's largest AI chip company sold $5.4 billion worth of its most advanced GPUs, the GB200, to a company called Valor.
Valor is not a real operating business. It is a special purpose vehicle, a shell company created specifically to hold these chips and nothing else. Nvidia also invested $1.9 billion of its own money directly into Valor on top of the sale.
Those 100,000+ chips are now physically inside xAI's data center. xAI is Elon Musk's artificial intelligence company, the one that builds Grok. xAI is using every single one of those chips right now to run its AI models.
But here is what Burry is flagging.
Neither Nvidia nor xAI owns those chips on paper. Valor, the shell company holds legal title. That means $5.4 billion in GPU assets do not show up on Nvidia's balance sheet as inventory.
They do not show up on xAI's balance sheet as assets. They are legally invisible to both companies.
Nvidia gets to book the $5.4 billion as a completed sale and record it as revenue. xAI gets full use of the chips without owning them. And the risk disappears into a shell company in the middle.
Now here is where American retirees enter the picture.
Valor needed $3.5 billion in debt to fund this structure. Apollo provided it. Apollo is one of the largest asset managers on earth with $1.03 trillion under management and $834 billion specifically in private credit.
Apollo raised the $3.5 billion, packaged it into debt securities, and sold those securities to Athene.
Athene is Apollo's own insurance company. It sells fixed and indexed annuities, retirement savings products, to ordinary Americans.
When a retiree buys an Athene annuity, they believe their money is sitting in safe, stable investments. That money is now inside a structure funding Elon Musk's AI data center.
The numbers inside Athene are most alarming.
Athene holds $74.2 billion in reserves. It has moved $217 billion in assets into a captive insurer based in Bermuda, meaning those assets sit outside normal US insurance regulation and oversight.
Of the entire portfolio, 34.7%, equal to $103 billion, is classified as Level 3 assets.
Level 3 is an accounting classification that means there is no observable market price for these assets. No outside party can independently verify what they are actually worth.
The leverage sitting on top of those unpriced assets is 16 times.
Burry's says:
Every step of this structure is technically legal and publicly disclosed. But the entire thing was deliberately engineered across 8 to 12 steps to move credit risk off balance sheets and away from any market pricing.
- Nvidia books the revenue.
- Apollo collects the fees.
- xAI gets the computing power.
- And retirees sitting at the bottom of a 16x leveraged Bermuda insurance structure, holding $103 billion in assets with no market price carry the risk without knowing it exists.
JENSEN HUANG DOING IT AGAIN
IN TAIPEI, HE SAID THESE STOCKS ARE THE FUTURE:
$NOW — AI agents run inside ServiceNow's enterprise software stack
$CRWD — Security layer every AI factory must have running
$PLTR — Turns AI agent outputs into real government/enterprise decisions
$MSFT — Co-built the entire agentic PC platform with Jensen
$TSM — Only company on earth that can build these chips
AND HE HAS A DEAL WITH THESE ONES:
$HPE — Builds and ships the physical AI factory server infrastructure
$IREN — Owns the cheap power AI factories are desperately hungry for
$CRWV — The cloud Jensen personally called out by dollar valuation
$ARM — Every AI chip on the planet runs on ARM architecture
$DELL — First to rack and deploy Vera Rubin in production
$NVDA STILL SUPER EARLY SO DON'T MISS IT!
♻️ RESHARE this post and write 1 comment, I'll share my $HPE earnings play with you. It's tonight.
Price targets for each of Jensen Huang's favorite stocks (1 year from now)
$NOW → $300
$CRWD → $950-$1000
$PLTR → $220
$MSFT → $600
$TSM → $550+
$HPE → $100
$IREN → $80
$CRWV → $240
$ARM → $500
$DELL → $600
The best strategy is to get 6-12 months of expiry on call options.
Last week, Michael Harnett of BofA included this chart in his May 22 "Flow Show."
As this reposted thread below details, we have not seen the market this concentrated around a single theme in 150 years.
2/2
In the repost below, I argued that the stock market is the most concentrated in a single theme in 150 years. The last time we saw anything resembling this level of concentration was the railroads in the late 19th century.
It should be that way! The railroads literally transformed this country, and no other technology has had this potential until AI.
The chart below is the generic Gartner Hype Cycle. Yes, the "Peak of Inflated Expectations" is in the future. But I would argue we a lot of the expectaion curve to rise before we get their.
https://t.co/tEmL6v4QUg
Fiat currencies are in an eternal bear market against gold:
Since 1971, the US Dollar has lost -99.24% of its value against gold, the 2nd-largest decline among major currencies.
Over the same period, the British Pound has declined -99.57%.
The Euro would have lost -99.08% against gold if it had existed since 1971.
Furthermore, the Japanese Yen and Swiss Franc have dropped -98.27% and -96.07%, respectively.
Meanwhile, gold prices in US Dollar terms are up +11,119% over the same timeframe.
Own assets or be left behind.
Jesse Livermore mapped this pattern 100 years ago
He made $100 million shorting the 1929 crash using this exact framework Livermore's Speculative Chart maps how smart money distributes to retail before a major top We're at stage 6-7 - the first pullback after the trap.
@iGlobalGold Totally agree Christopher.
Stage 4 Decline in #SPX overdue. Not sure what the catalyst will be .... But if I had to pick one of many, I would suggest Bond Market collapse with lack of faith in Fraudulent Fiat and #Stagflation.
https://t.co/wUlacohNmw
Gen Z workers are disproportionately concentrated in the routine, white-collar, and administrative roles, such as data entry, customer service, legal support, and billing, that AI is best at automating.
Read more: https://t.co/NztVyhmjAe
🚨 MICHAEL BURRY WARNS THREE UPCOMING IPOs COULD COMPLETELY CRASH THE STOCK MARKET.
Michael Burry reported that the upcoming public listings for SpaceX, OpenAI, and Anthropic are going to pull more capital out of the market than the entire dot-com wave of 2000.
Adjusted for inflation, just these three companies will raise more money than the hundreds of tech firms that flooded the market at the peak of the 2000 bubble.
The historical data from 2000 shows exactly why this is dangerous for stocks.
That year, the market saw 446 IPOs raise a record $108.15 billion. The Nasdaq peaked on March 10, 2000, at the exact moment this massive supply of new shares hit the market, right before crashing 80%.
The crash happened because of a simple liquidity drain.
When giant companies go public, big institutional funds need cash to buy the new shares.
To get that cash, they have to sell their existing stock positions. This creates immediate selling pressure on the most expensive tech stocks.
Today, the setup is identical but much more concentrated. Instead of hundreds of small startups spreading out the drain, just three mega companies are absorbing the market's capital.
This directly impacts current market leaders.
Microsoft has 49% of its $627 billion cloud backlog tied to OpenAI, and Oracle has 54% of its pipeline dependent on it.
The same big funds that need to buy the new IPOs are the ones currently holding these tech giants.
In the first quarter of 2000, the average IPO nearly doubled on its first trading day because cash was easily available.
By the fourth quarter, capital markets dried up.
Gross IPO proceeds collapsed 63% in a single quarter, and average first-day gains dropped to just 14% as companies rushed into layoffs and bankruptcies.
When an unprecedented amount of money is pulled out of existing stocks to fund a single massive IPO wave, the broader market historically runs out of the liquidity needed to sustain its peak.
Congratulate yourself!👏👊
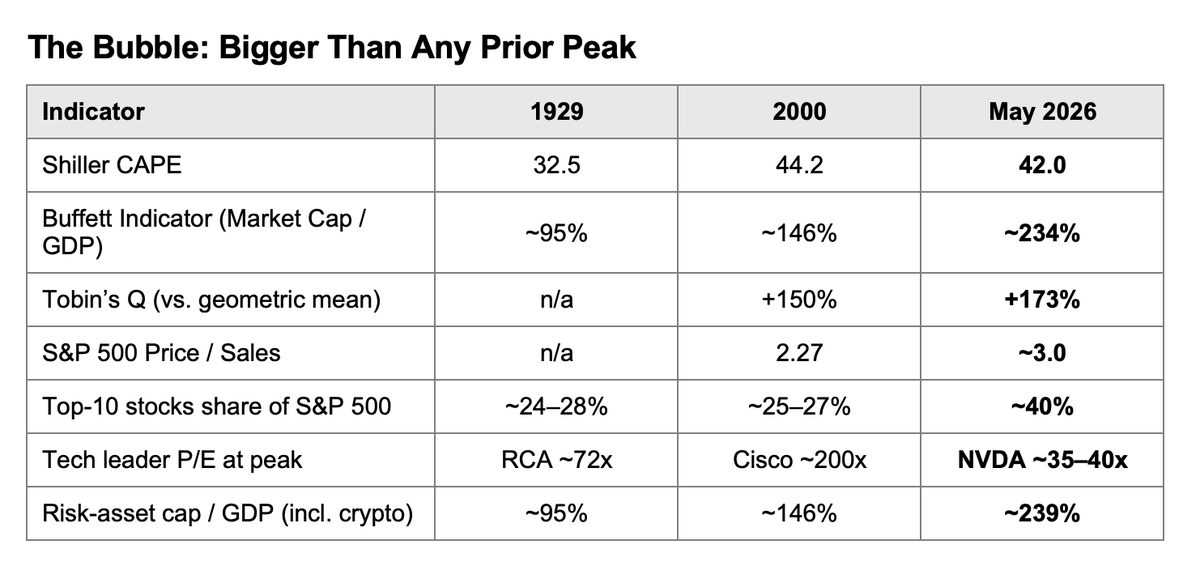
We are living in extraordinary times.
The Market Bubble is the Largest we have ever seen!
We did it!
Now - let's push it a bit further before it pops.
Most traders buy stocks that barely move.
Then they wonder why their account stays flat.
A stock that moves 20–30% in 6 months will not change your account if you trade small position sizes.
That’s why I focus on fast movers only. Stocks with high ADR% — usually 4–5%+.
Why?
Because these stocks can move 30–50% in days or weeks.
That changes everything.
Here’s what I look for 👇
1. High ADR%: I want stocks that can actually expand fast. Slow stocks create slow account growth.
2. Strong Momentum: The best stocks move with urgency. They attract institutions, momentum traders and attention.
3. Tight Setups: Big movers often give clean flags, VCPs or pullbacks into EMA8/EMA21. That allows tight risk.
4. Small Stops: A stock with 5% ADR and a 3–5% stop can create asymmetric trades very quickly.
5. Strong Themes: AI, semiconductors, crypto, power, space. Fast-moving stocks usually come from leading themes.
6. Relative Strength: I want stocks already outperforming the market. Leaders lead for a reason.
Most traders focus too much on “safe” stocks.
But if your stock barely moves, your account barely moves too.
The goal is not activity.
The goal is asymmetric reward.
One strong leader can change your whole month.
That’s why I spend so much time screening for fast-moving stocks with clean structures and strong stories behind them.
These patterns repeat.
I’ve taught this to thousands of traders.
You can learn this too.
The 28-Year Cycle in the U.S. Stock Market. 📊
This dominant time cycle was the driving force behind the last two secular "lost decades" in equities:
🔴 The stagflationary 1970s
🔴 The Dot-Com / GFC crash of the early 2000s
As mapped below, the S&P 500 is fast approaching the cliff of another major down-phase.
Time is running out for this macro expansion. Are you prepared?