Extension update: you can now stream OpenTelemetry metrics, logs and traces to @ApacheIceberg, DuckLake, Parquet or, uh, maybe Google Sheets inside a @duckdb process.
https://t.co/0hRU6jeZ1K
@chythram1 I’ve got a good test case: an open-source project that has a worker that writes to a pipeline that writes to r2 data catalog. Deploy button seems to work great for simple workers but breaks once you start layering on components that live outside of wrangler.toml
@mitchellh@ellie_huxtable The thing that was the worst about zellij (despite vastly superior UX!) was how poorly in worked vs tmux in the popular iOS terminal apps — Blink, etc had all sorts of weirdness re: keyboard shortcuts and scrolling.
@RhysSullivan@dillon_mulroy then store it in s3 or r2 in parquet format + query with duckdb, months of traces from sessions fall under the free tiers. https://t.co/MlEEG1GGHW
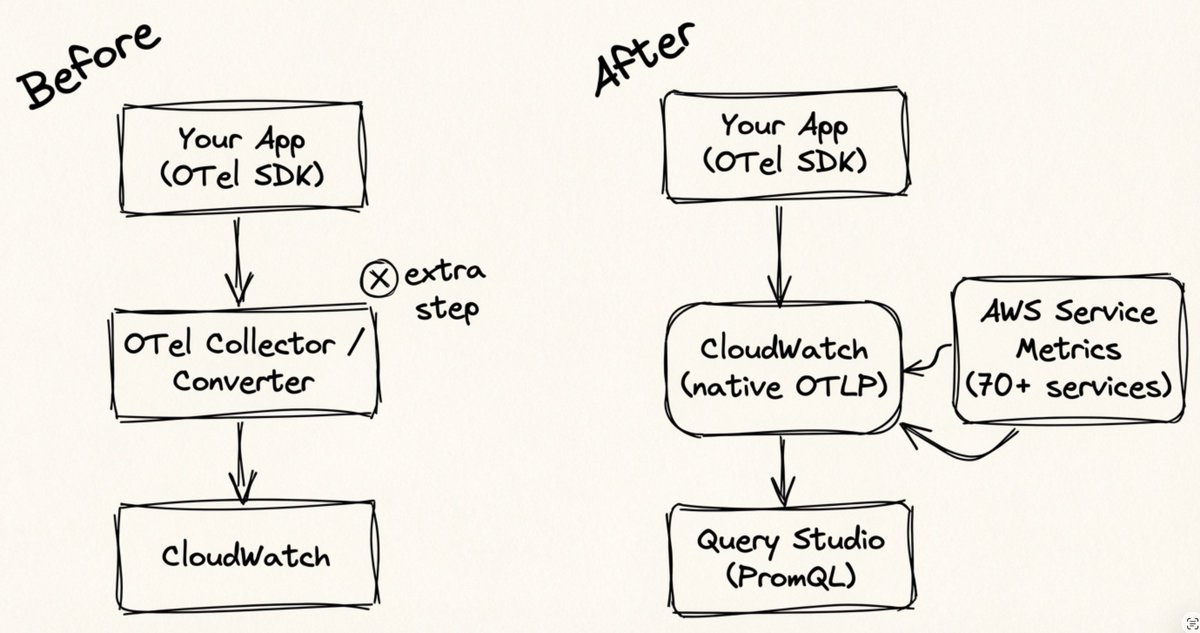
AWS just shipped native OpenTelemetry metrics support in CloudWatch. This one got buried under the S3 Files announcement, but it deserves more attention!
.@kmad's post re: RLM+Dataframes + @isaacbmiller1's talk at dSPY SF sent me down a rabbit hole today: querying otel logs from R2 data catalog ... works great. Bonus: have Claude Desktop visualize the results.
https://t.co/rATgGAwabH
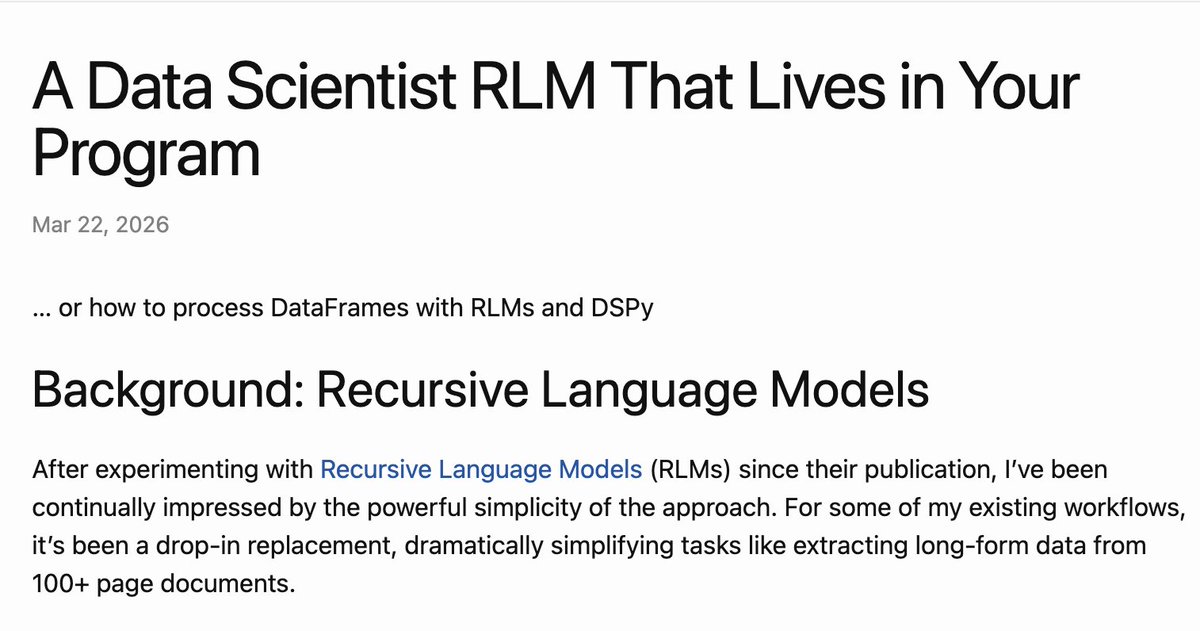
What if we combined RLMs with DataFrames?
Recursive language models by @a1zhang and @lateinteraction are a promising new direction for LLMs...
... but initially only operate on strings. The REPL they use is capable of much more than that.
By combining RLMs, DSPy, and DataFrame support you can do things like achieve ~87% on DABench in 15 lines of code, largely by "getting out of the way" of the model.
The approach is fairly simple:
- Import the required libraries into the REPL sandbox for your type, in this case pandas and pyarrow for efficiency
- Define a serialization approach to get the data from host to sandbox
- Define the Output fields you want
- Let the model loose in the REPL; it will iteratively explore and analyze the data until it's ready to return the response
observability friends: claude now can natively make **really good** instant monitoring dashboards natively in the app from pretty much any API using the visualization/chart support that launched today.
... just tell it what you want too see, the controls/layout you want, and it works (with analysis/commentary) 🥹
Claude can now build interactive charts and diagrams, directly in the chat.
Available today in beta on all plans, including free.
Try it out: https://t.co/tHPAZRgQkn
@_brimtown [water surges forward, lifeboats clatter, British engineer posts to Slack]
“Gentlemen, it has been a privilege going on-call with you tonight”
[gets one 😅 emoji reaction]
Found it easier to explore with dSPY (also has a typescript cousin, ax-llm, that also seems to support RLMs). Was a blast. Getting the tool call vs sub-llm delegation was kind of an art (lots of good discourse on X from the paper authors around this).
Shameless plug: have an RLM compose a soundtrack while you learn about RLMs? https://t.co/QaMrAySo53
Was a good way to get more familiar with the pattern, think RLMs have potential for more this sort of open-ended creative work. Also really good at navigating extremely complex software with hundreds or APIs (and instruments/music choices). Kudos to @lateinteraction and @a1zhang
Like a lot of people, been playing with RLMs in @DSPyOSS. Used it to compose electronic music in @Ableton and have to say it sometimes creates some bangers.
Github (with soundcloud link lol) @ https://t.co/MEDruquGV4