@MarchForRejoin@BritainUnbound The UK held a permanent, legally binding exemption (opt-out) from the euro. However, the EU has indicated that if the UK returns, it will be treated as a new applicant under A 49 of the Treaty on EU and would not be granted a continuation of its previous, exceptional opt-outs.
Riddle me this.
If UK GDP was so affected by Brexit, then why is it that the change in GDP per Capita of the UK and Canada is so similar for the whole period of 2010-2023?
Did Canada leave the EU too?
Data from World Bank website.
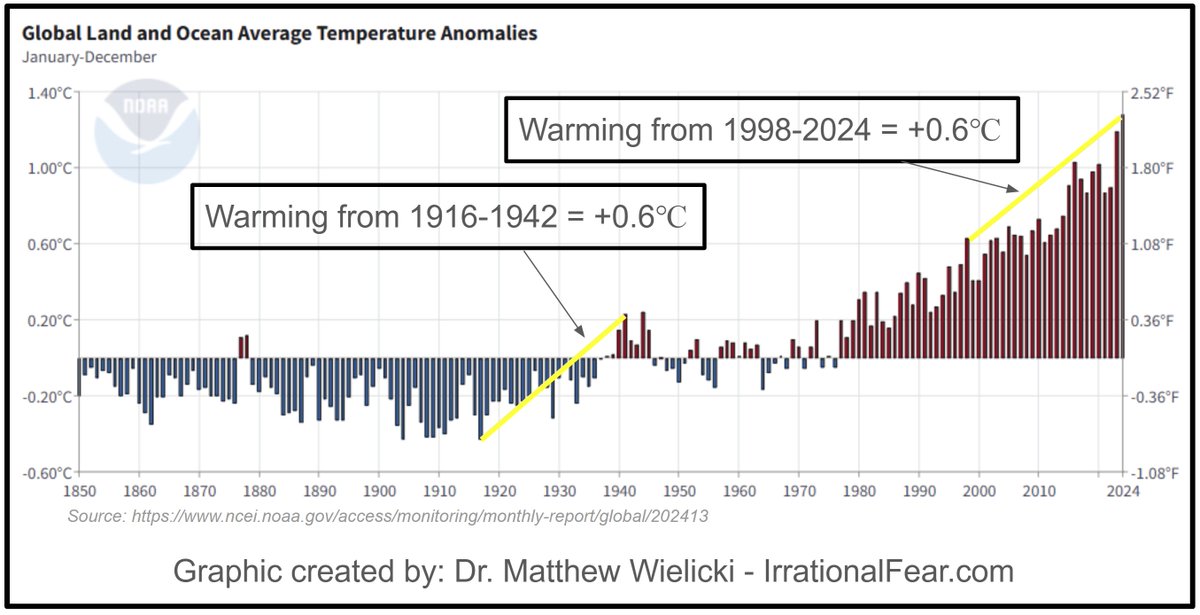
🚨 @NOAA data confirms: recent warming is no greater than the early 20th century.
Take a close look at the chart above. It’s sourced directly from NOAA and annotated for clarity. The warming from 1916 to 1942—about +0.6°C over 26 years, matches the modern warming from 1998 to 2024, also +0.6°C. Same rise. Same magnitude. Different cause.
Here’s the kicker: the earlier warming happened when atmospheric CO₂ levels were still low and relatively stable.
This one chart delivers a devastating blow to the core climate narrative, that recent warming is both unprecedented and primarily caused by human CO₂ emissions. It’s neither.
If natural factors could drive that warming then, why are they written out of the equation now?
The answer is political, not scientific.
If we accept that modern warming is not exceptional, then the justification for emergency climate policy collapses. No runaway acceleration. No historical uniqueness. Just a familiar natural rhythm miscast as a crisis.
This NOAA chart is the smoking gun. It proves the climate has warmed like this before, and will likely do so again. The rational response is to understand it, not panic over it.
It’s time to stop mistaking normal for catastrophic.
Graphic created by: Dr. Matthew Wielicki — https://t.co/oHJwRZw7wW
Data source: https://t.co/oZANmdaM3P
Back in June, a fortnight before the government’s landslide election victory, I warned in my weekly "Economics Agenda" column in the @Telegraph that "ghosts of the 1970s haunt Labour’s economic resurrection”.
Would-be Chancellor @RachelReevesMP claimed ahead of the election that her party could significantly increase government spending “without raising taxes on working people”.
Labour’s “pro-growth” policies would deliver the economic expansion needed to allow the government to take on more debt to fund lots of extra spending, we were told.
The Tories had, of course, already pushed the UK’s tax burden to 100pc of GDP – a 60-year high.
But the argument seemed to be that Reeves could jack up government borrowing even more because she “used to work at the Bank of England” and her name wasn’t Liz Truss @trussliz
Here's my column from six months ago
🧵 1/5
https://t.co/IYWmWc3QML
"I am firmly of the belief that the future will show that this whole hysteria over climate change was a complete fabrication."
– Dr. Patrick Moore, co-founder of Greenpeace.
I'm Italian.
Over the years, it's been painful seeing Europe’s demise:
1960 - EU was 36% of global GDP
2008 - US GDP surpassed EU
Today - US economy 50% larger than EU
But why such a decline and is there any hope?
Here's everything you need to know about the fall of Europe:
Since i've had a few people question my statement earlier, about UK GNI as a proportion of EU total GNI being higher now than it was a decade ago - here is all the data to back it up.
UK GNI figures from the ONS
https://t.co/eKXdVjR24A
EU27 figures from the EU themselves, in Euros, for 2023
https://t.co/D7QyUHlZXT
World Bank data on EU27 GNI, in USD, for 2014
https://t.co/iaqMXdXAH4
EU27 GNI in 2014 (in $) = $15,437,850,000,000
UK GNI in 2014 (in £) = £1,829,242,000,000
UK GNI in 2014 (in $) = $2,439,636,000,000
EU27+UK GNI (in $) = $17,877,486,000,000
UK GNI as % of EU27+UK GNI = 13.65%
EU27 GNI in 2023 (in €) = €14,559,594,000,000
UK GNI in 2023 (in £) = £2,652,321,000,000
UK GNI in 2023 (in €) = €3,150,468,000,000
EU27+UK GNI (in €) = 17,710,062,000,000
UK GNI as % of EU27+UK GNI = 17.79%
Polite request to those still holding onto their #FBPE red sashes like they are the cowboys of Tombstone fame.
Please do show me on the graph below, where the EU is doing better than the UK. Go ahead.
My thanks to @julianHjessop for continuing to make sure this data is seen.
🚨FIFTY BREXIT BENEFITS - MEGATHREAD🚨
I have collated 50 tangible Brexit benefits, fully evidenced and demonstrably true.
Some may not like that they exist - but that doesn't change the fact that they do.
👇Scroll down to see them in this megathread 👇
#BrexitBenefits2024
Initial thoughts on the #KingsSpeech
Of the 40+ Bills and commitments within the speech, at least 7 of them would not be possible either in full or in part, without having left the EU.
Labour is demonstrating #BrexitBenefits - whether it wants to admit to it or not.
Are you, like me, fed up of seeing people claim that Brexit was all about tax avoidance for the super-rich?
If so, please feel free to send them this FullFact explainer - that says the claim is "completely baseless" and that Terry Christian made it up.
https://t.co/IVoHxxETaL
🚨FIFTY BREXIT BENEFITS - MEGATHREAD🚨
I have collated 50 tangible Brexit benefits, fully evidenced and demonstrably true.
Some may not like that they exist - but that doesn't change the fact that they do.
👇Scroll down to see them in this megathread 👇
#BrexitBenefits2024
The air is dry and water vapor accounts for 97% of the greenhouse effect.
Air consists of:
📍78% nitrogen
📍21% oxygen
It's pretty much everything‼️
Small residual gases though.
📍0.93% argon
📍0.0420% carbon dioxide (barely measurable that ppm is used)
📍0.0002% methane
Humanity's 10 GtC/year (36.66 Gt CO2) corresponds to approximately 4% of the natural flows.
Humans globally contribute 0.0017% (4% of 0.04%)
The level of carbon dioxide in the air is frighteningly low, even after the increase from 0.03% to 0.04%
The increase of 0.01% means 1 extra molecule per 10,000
The levels are so low that the air now only contains trace amounts of carbon dioxide
Data presented by the Swedish Agricultural Agency shows that the yield of Scandinavian bread grain plants drops rapidly towards zero already when the carbon dioxide content approaches 0.02%.
The starvation limit for today's C3 plants is around 0.02%.
Carbon dioxide has become a biological shortage, for which there is strong competition‼️
Increasing carbon dioxide levels are not life-threatening, but strongly life-promoting
They provide more food for the plants and thus also for animals and microorganisms.
📍Greener world
📍Improved food supply, we can feed more people
📍Gives the plants the opportunity to save water by forming fewer cleavage openings
📍Strengthens plants' nutrient uptake, resistance to ozone, and tolerance to high temperatures
📍Beneficial for plants.
The carbon dioxide content of the air is not frighteningly high, but frighteningly low‼️
The world's most important cereal, rice, gives optimal yields at a carbon dioxide content of around 0.10%. Almost all examined plant species have had growth increases of the order of 25-100% at 0.10% carbon dioxide content. And when plants are healthy, so are herbivores, predators and microorganisms. Life becomes more lush at higher levels.
The Covid 19 pandemic meant a gigantic reduction in anthropogenic carbon dioxide, where the closure of large parts of the economy did not leave the slightest impression on the carbon dioxide content of the atmosphere
The relationship between temperature and carbon dioxide content is logarithmic, not linear. This means that the temperature decreases logarithmically with the content.
There is an equilibrium balance between the CO2 content of the surface ocean and the air, i.e. if our anthropogenic emission of 0.0017% disappears, the ocean responds by releasing 0.0017% so that equilibrium balance prevails again.
It seems totally pointless and unwarranted to worry that our use of fossil fuels will plunge us into ruin by increasing the carbon dioxide content of the air.
Carbon dioxide pales in comparison to water vapor
The atmosphere contains a few percent of water vapor, which is 4 times more effective than carbon dioxide as a heat-absorbing greenhouse gas and is present in 40-80 times higher concentration in the lower air layers
Water vapor is the greenhouse gas that, in terms of radiation, affects the atmosphere's temperature balance the most
Peer-reviewed study:
📍Carbon dioxide emissions cannot cause "global warming."
📍Not only did they find that higher levels of carbon dioxide made no difference, but they also showed that it is simply not possible for increases in carbon dioxide to cause temperatures to rise.
It is very clear that CO2 and temperature have been out of sync more often than they have been in sync.
Emissions of carbon dioxide are quickly absorbed by the sea and do not accumulate in the atmosphere to any great extent.
-Henry's Law.
Earth has been much more than 1.5 degrees warmer for most of its history. We happen to be in a warming that is now known as the modern warm period. But the modern warm period emerges from the Little Ice Age, which peaked around 1600 – long before we started using fossil fuels
https://t.co/0H94yZOt3i
#ClimateScam