It stops explaining anything once they hit checkout.
Built with DAX (DIVIDE, AVERAGEX, SWITCH) + Power Query for channel cleanup + a dynamic funnel visual.
Sometimes the flat line tells you more than the chart full of variance would have.
Dashboard : https://t.co/qjr8ABuJ5f
Built a Power BI funnel dashboard expecting to find a "bad channel." Found something better.
Tracked visit → cart → checkout → purchase across 6 channels .
Every single one converts cart-to-checkout at exactly 55%.
#PowerBI#DataAnalytics#DAX
Paid. Social. Organic. Direct. Identical.
That's not a channel problem . That's a checkout problem. Whatever's stopping people is hitting everyone the same, regardless of where they came from or how much intent they walked in with.
Channel explains who shows up.
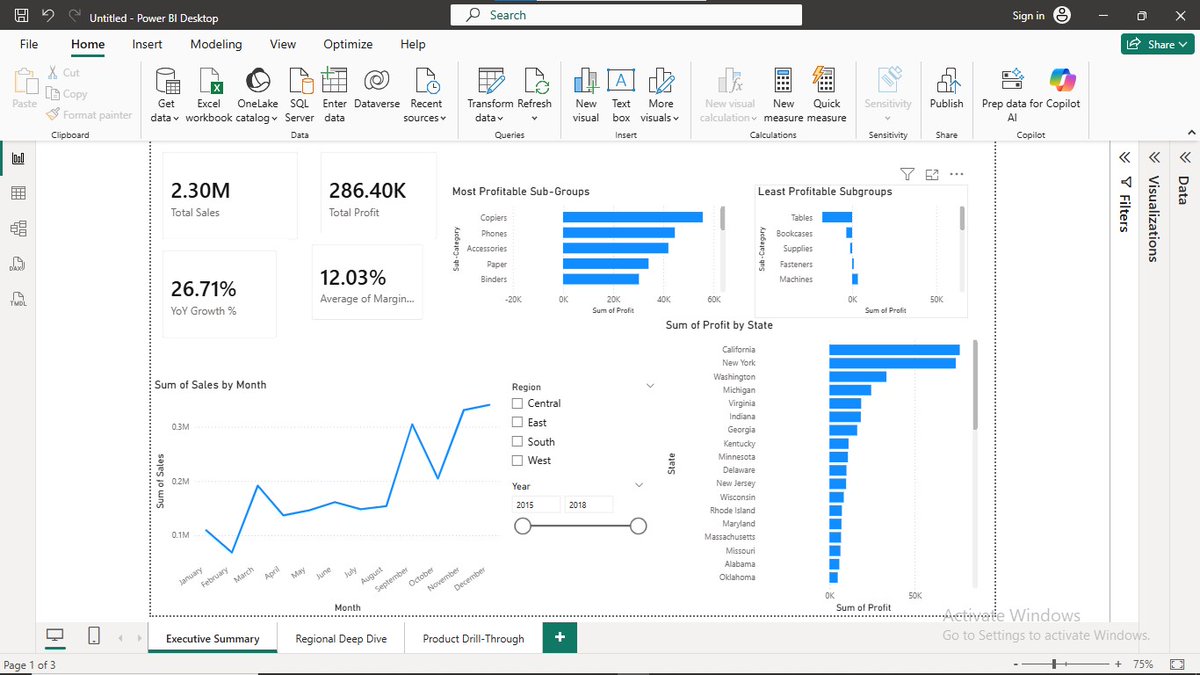
I recreated the kind of sales reporting challenge retail businesses face. The company had plenty of sales data, but it was difficult to see where revenue was growing, where profit was being lost, and which areas needed attention.
https://t.co/NO9CEL3ewy
#powerbi
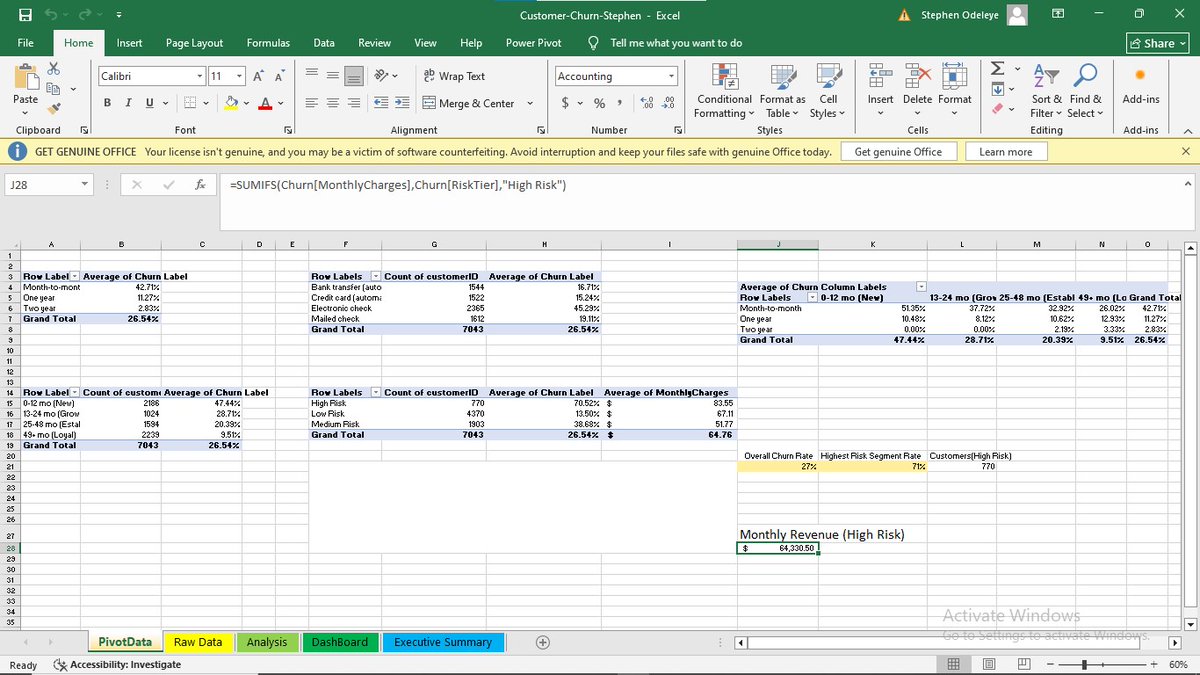
Using the popular Telco Customer Churn dataset, I analyzed 7,043 customer records in Excel to understand why customers were leaving and what the business could do about it.
Full Article: https://t.co/OOawJcOslU
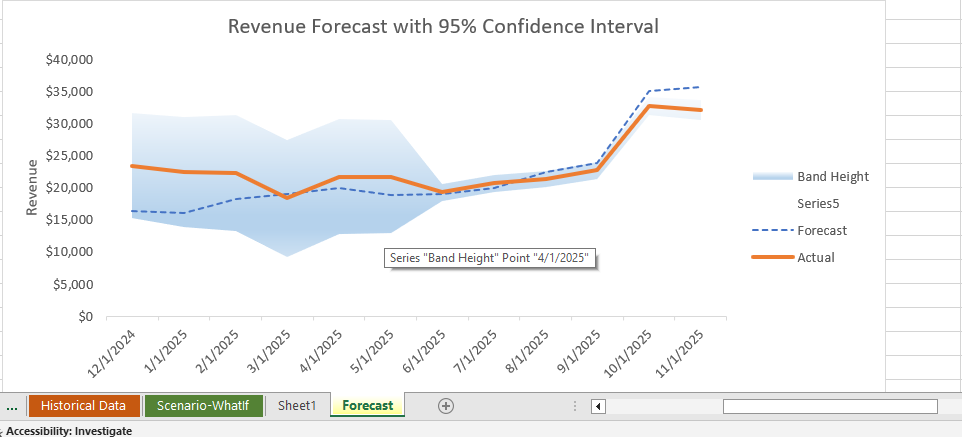
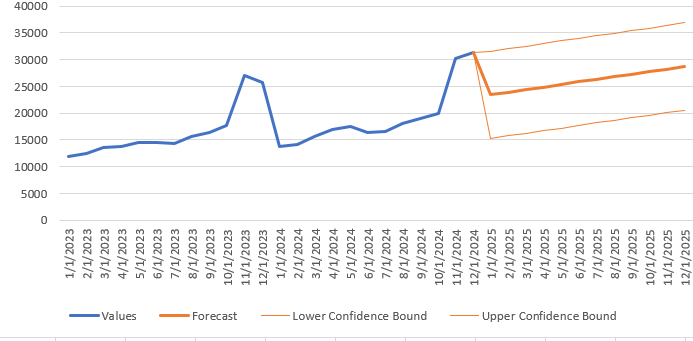
I created a complete financial model in Excel using three years of historical data, a dynamic 12-month budget, what-if analysis, and a statistical revenue forecast.
Workbook and Walkthrough: https://t.co/NfmcsdCIky
I built an HR analytics model the way most companies' real data actually shows up: scattered across three separate files.
Check it out: https://t.co/FEJCdGln6i
Connect with me: https://t.co/tGpUC3F5Ov
@omoalhajaabiola@n8n_io@JanOberhauser@skill_afrika_@skill_afrika_ I'm diving into n8n for AI agents and automation
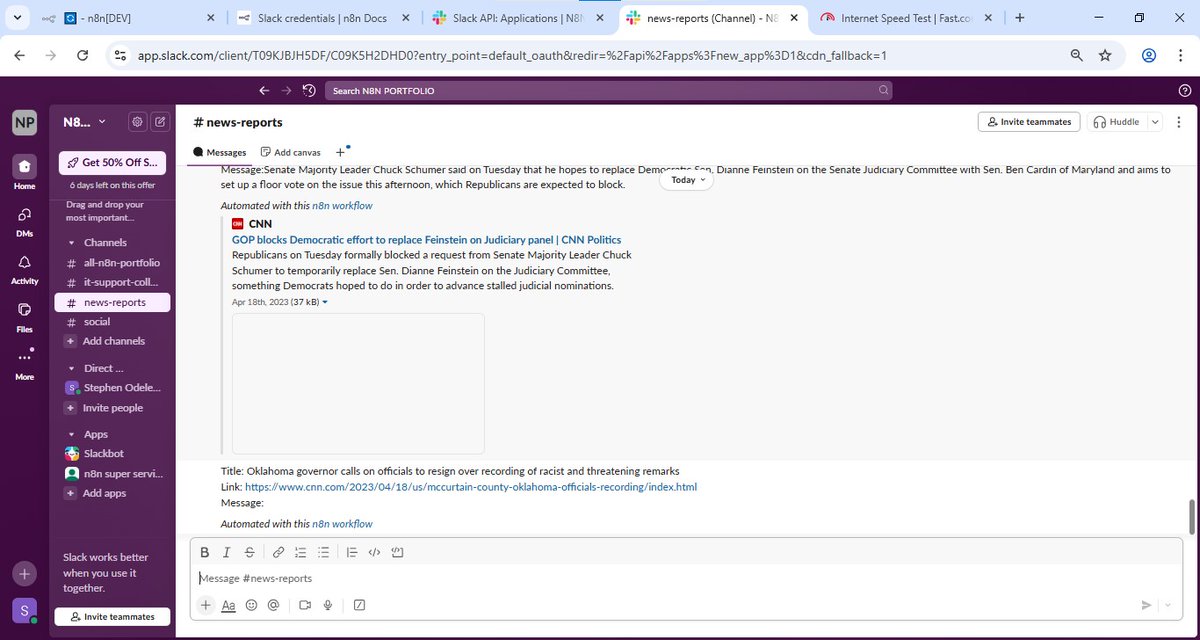
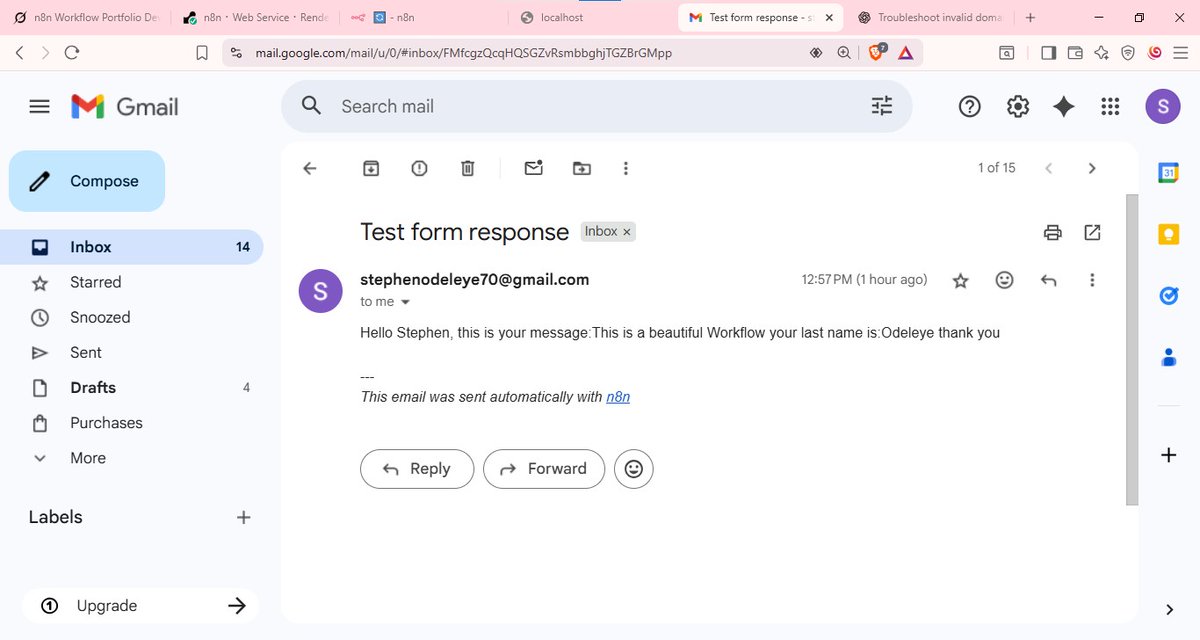
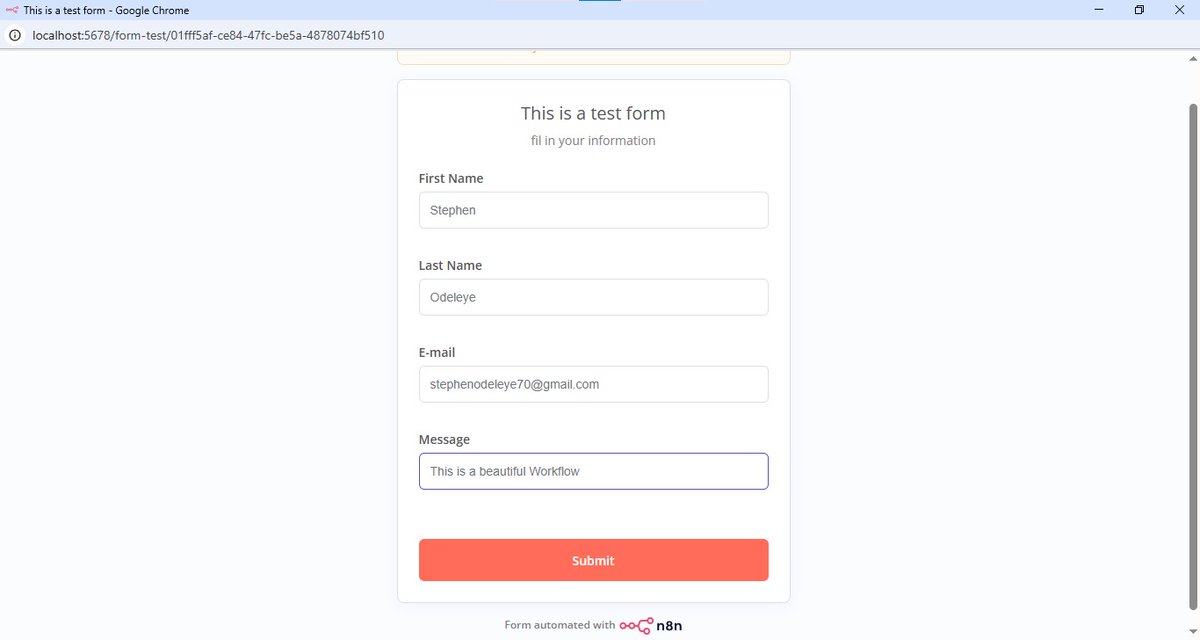
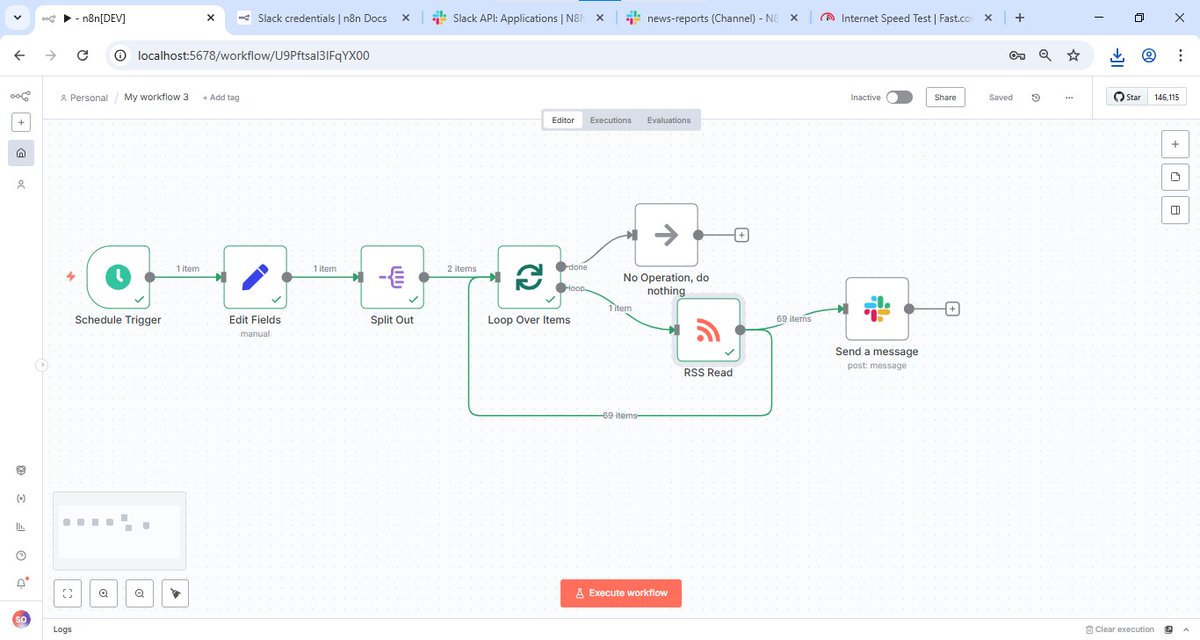
I've already built a couple workflows: one that grabs form submissions and emails them out, and another that pulls RSS feeds on a schedule and posts updates to Slack. Attaching screenshots below.