15 years of capital market research experience | U.S. stock value investing analysis | company fundamentals research | guiding investors to develop long-term we
🚀📈 Daily delivery of 3 stock indicators to fans on a routine schedule! ✨
💰🔥 The historical rate of return for these three indicators stands at approximately 30%–40%! 💎📊
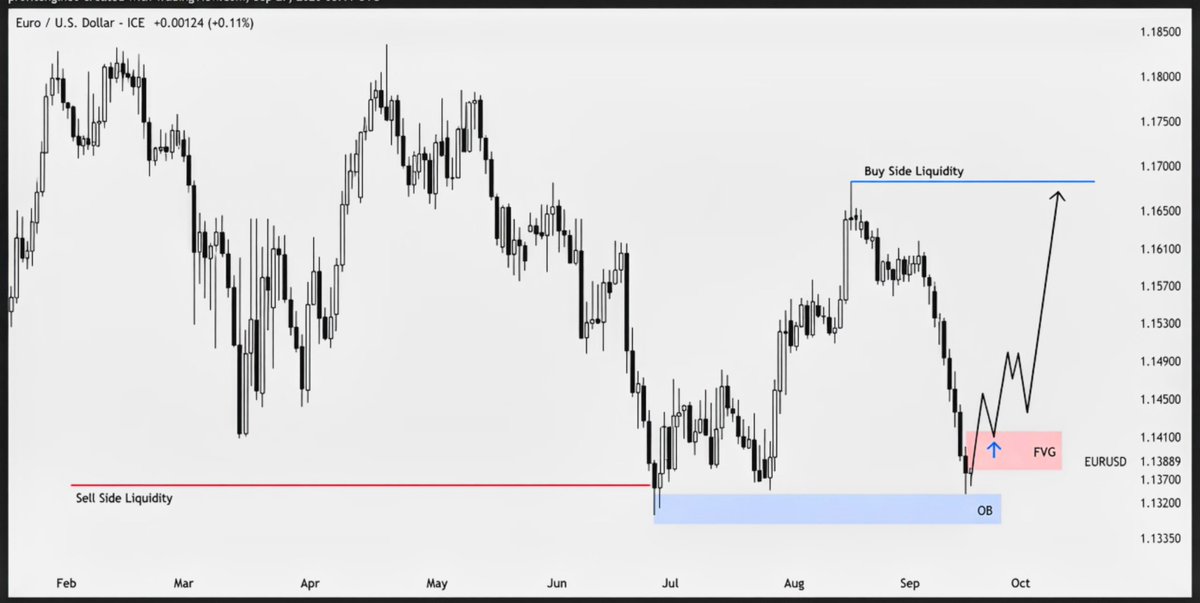
EURUSD daily chart shows SSL liquidity sweep, currently holding the order block. A sustained close above this bearish FVG will validate the bullish setup, while a breakdown invalidates this bias.
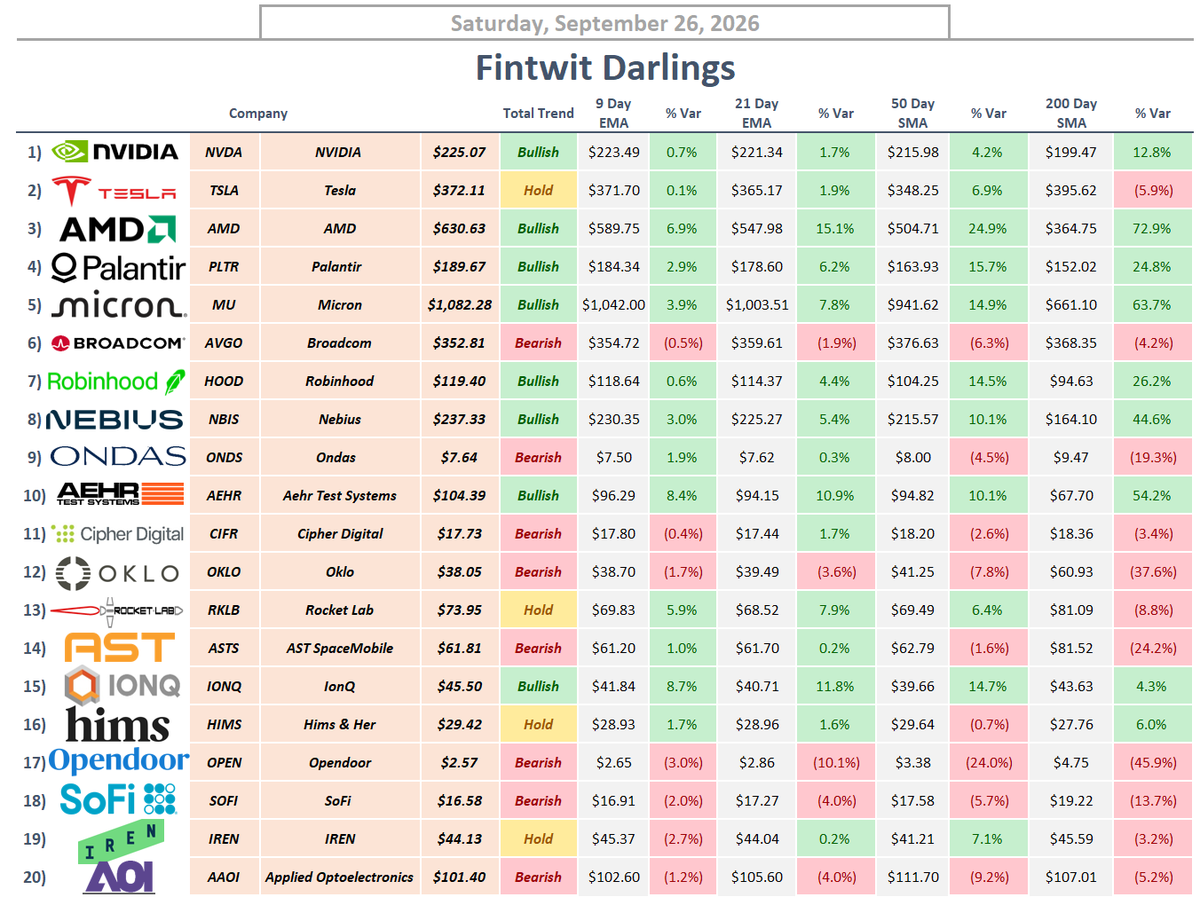
This watchlist sorts stocks by trend bias. Remember: labels are just a snapshot, not buy/sell guarantees. Always check volume and risk management before entering.
$HIVE
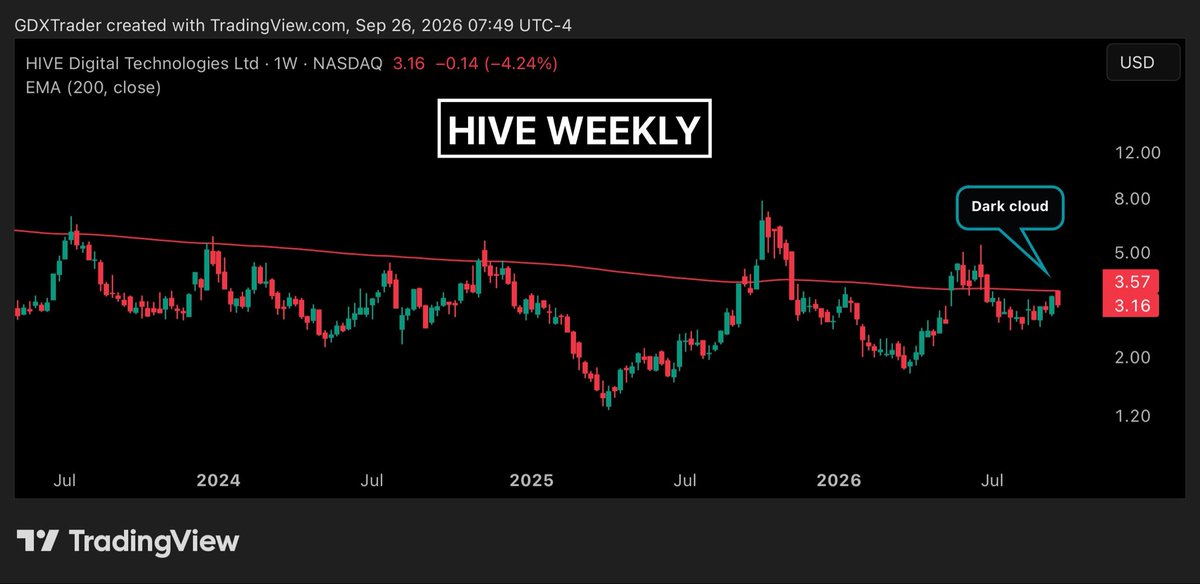
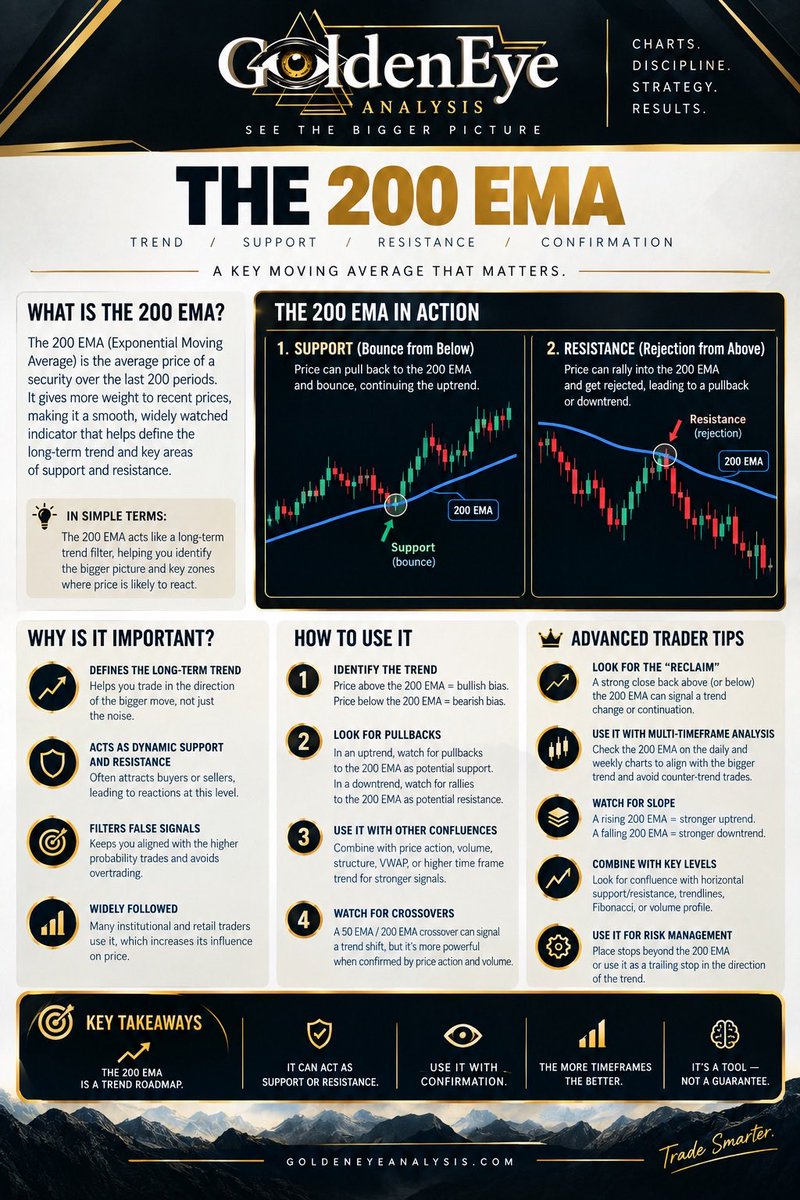
$HIVE was rejected once again last week at the 200 EMA, reinforcing the significance of this moving average as a dynamic resistance level that has repeatedly capped price over the last few years.
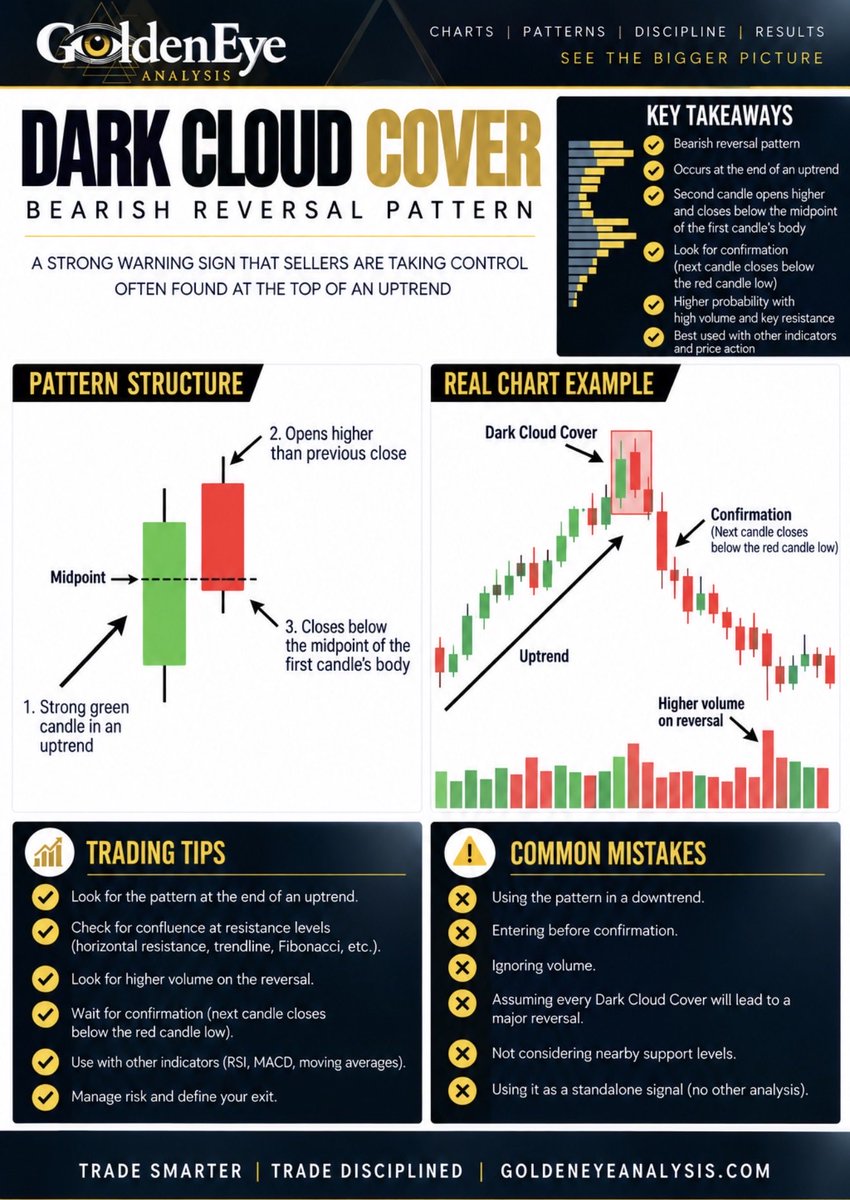
The rejection also produced a Dark Cloud Cover candlestick pattern at the 200 EMA, reflecting seller response and potential exhaustion of the current upside attempt.
If we see bearish follow-through next week, it could establish another lower swing high and further reinforce the existing compression structure.
From a longer-term perspective, patience may be warranted here, with a cleaner setup potentially developing once price breaks out of this compression zone and decisively clears the series of lower highs.
𝐉𝐨𝐢𝐧 𝐆𝐨𝐥𝐝𝐞𝐧👁️ 𝐚𝐧𝐝 𝐠𝐞𝐭 𝐚𝐜𝐜𝐞𝐬𝐬 𝐭𝐨:
• Receive real-time alerts on my personal trades
• All my setup in a centralized chat room grouped by commodity
• Japanese candlestick pattern strategies
• Watch daily video reviews with tradable setups on #GOLD, #SILVER, #NATGAS, #URANIUM, $WTI, #COPPER, #BITCOIN, #COFFEE, and more commodities
• Access educational content to help you build your trading plan
• Access to our private trading chat room
• Get unlimited on-demand chart reviews for your own setups
Join us at https://t.co/piEjMamo61
Chat Room Free Trial:
https://t.co/9J76VmgpA7
$HUT $IREN $CIFR $CLSK $WULF $CORZ $RIOT $MARA $BTDR $APLD $BITF $ARBK
$DVN
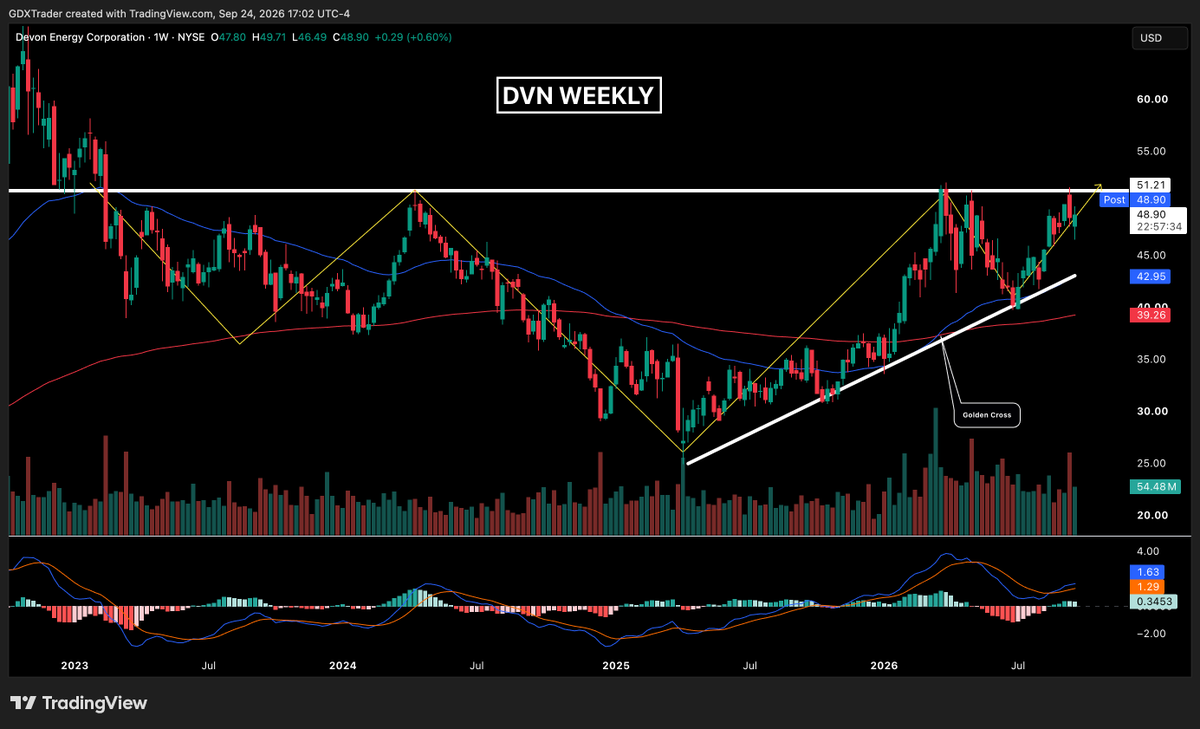
$DVN continues to develop the potential inverse head-and-shoulders pattern we highlighted on April 20, with price now building the right shoulder.
There’s no confirmed breakout yet, so the neckline remains the key level bulls need to reclaim.
For now, $DVN stays on breakout watch as the structure continues to develop.
$EOG $FANG $COP $OXY $APA $CTRA $EQT $AR $MRO $PR $CHRD $OVV
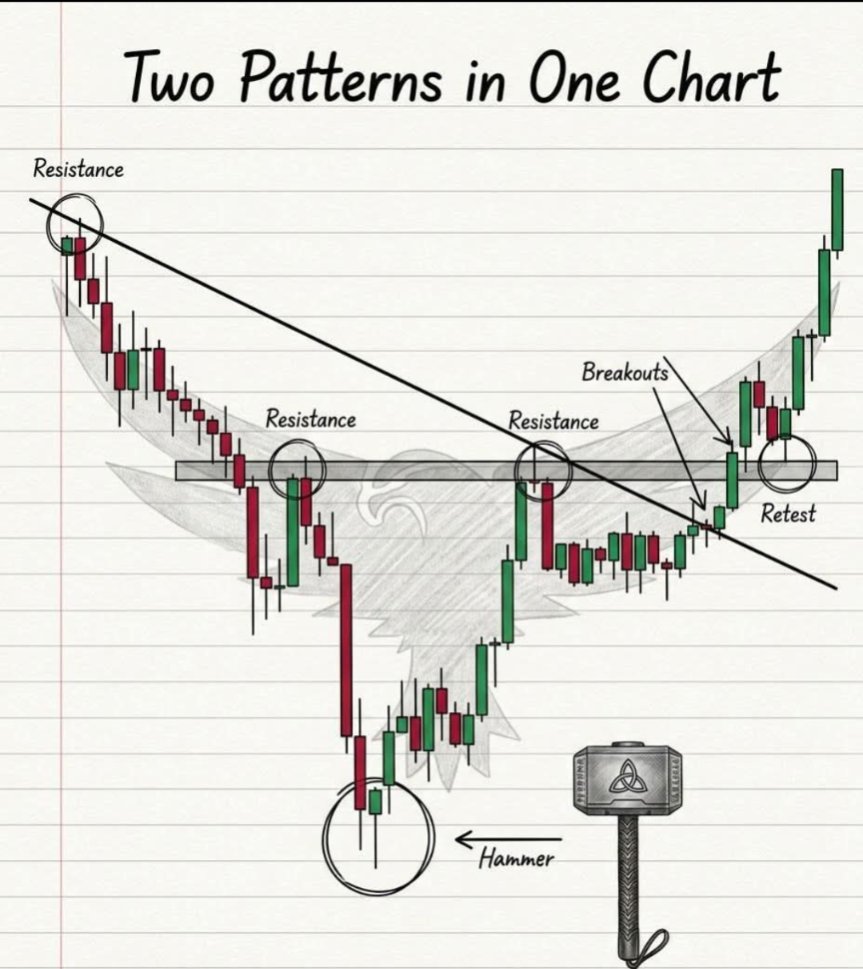
TWO PATTERNS, ONE CHART
DOUBLE CONFIRMATION = STRONG ENTRY!
✅ Hammer reversal signals the end of selling pressure
✅ Breakout above resistance shows buyers taking control
✅ Retest validates the breakout before continuation
This is how disciplined traders combine candlestick signals with breakout strategies to catch high‑probability moves.
Trade smart: respect resistance levels, wait for confirmation, and let the market prove itself before committing.
The Arctic oil and gas resources in Greenland have received full financial support. After a significant increase, there has been a pullback and consolidation. Currently, it is in a consolidation phase after a significant rise. The position needs to be controlled.
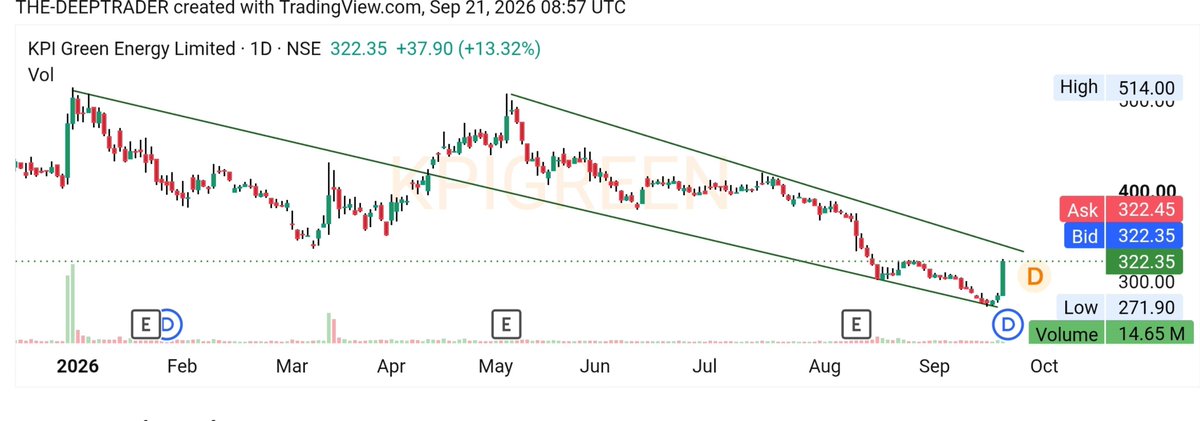
#KPIGREEN shows a chart reversal with heavy trading volume, jumping +13.32%. The breakout from a long descending channel looks promising, but confirmation on subsequent candles is needed; sharp single-day moves can trigger quick pullbacks.
Great point. 200x MLCC demand jump for next-gen NVIDIA servers is an underrated AI infra bottleneck. Watch high-cap MLCC makers, but supply ramp timeline will be the key risk.
A normal server uses roughly 2,500 MLCCs.
NVIDIA’s next-generation AI server could use as many as 560,000.
That is more than 200X.
This is one of the least discussed bottlenecks in the AI infrastructure buildout.
MLCCs are tiny components that stabilize power delivery inside electronic systems.
But as AI servers consume more power and run 24/7 under extreme heat and voltage, they need dramatically more high-capacity, high-reliability MLCCs.
And the economics are completely different.
→ AI server MLCC demand by 2030: ~25X 2023 levels
→ Expected annual demand growth: ~30%
→ High-capacity AI MLCC pricing: 30–40X conventional products
→ NVIDIA next-gen AI server: up to ~560,000 MLCCs
→ Conventional server: ~2,500
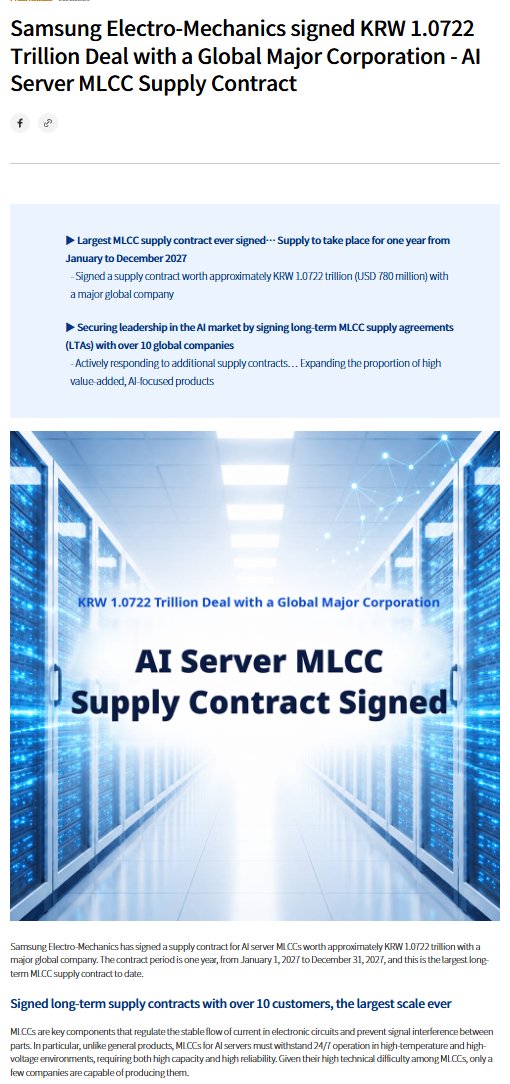
Samsung Electro-Mechanics (009150.KS) is already positioned directly inside this trend.
The company recently signed a KRW 1.0722 trillion AI-server MLCC supply contract with a major global customer — its largest MLCC supply agreement ever.
It now has long-term MLCC agreements with more than 10 global customers.
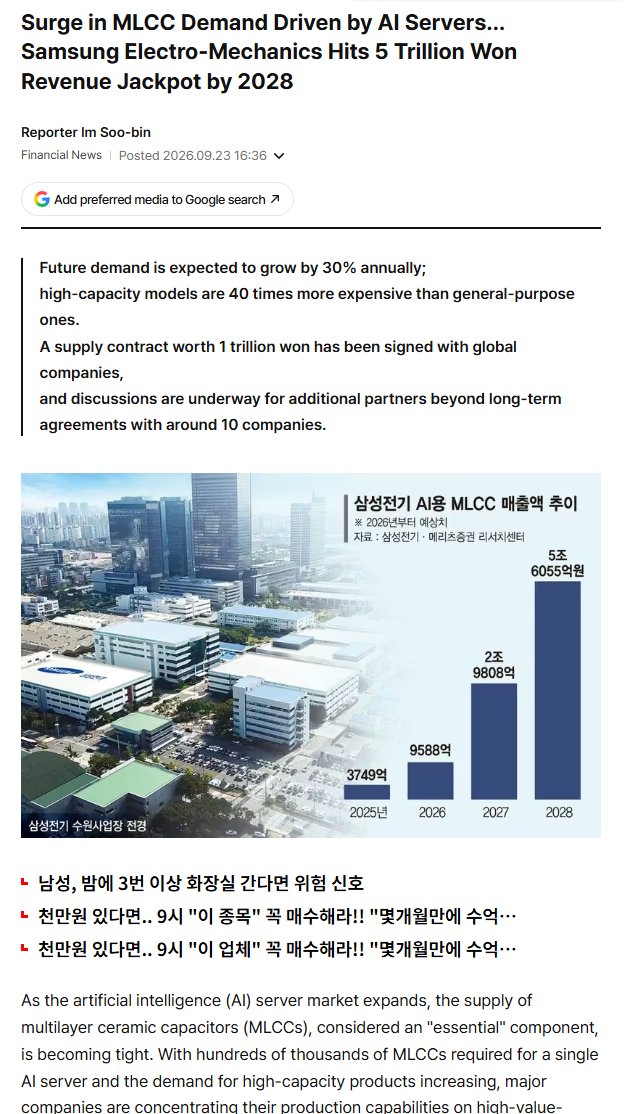
Brokerage estimates cited by Korean media see Samsung Electro-Mechanics’ AI MLCC revenue rising from:
2026: KRW 958.8B
2027: KRW 2.98T
2028: KRW 5.61T
That is the part I’m watching.
The AI infrastructure trade is expanding beyond:
GPU → HBM → Power → Cooling
Now another layer is emerging:
Power delivery components.
$NVDA
Samsung Electro-Mechanics — 009150.KS
The smallest components inside an AI server may end up becoming some of the biggest beneficiaries of the AI capex cycle.
Solid point on $SIVE. Its collaboration with O-Net & Enablence on ELS puts it in a great position across AI optical stacks. A potential CPO dark horse, but don’t overlook the gap between story and real revenue.
I personally think $SIVE has the setup to become a mini-$LITE type story.
Not because every CPO headline has to work immediately.
Because Sivers is starting to show up across too many optical architectures at once.
In the past few months alone:
1. O-Net + Enablence partnership for external light sources in AI data centers.
2. $JBL collaboration for 1.6T LRO pluggable transceivers using Sivers DFB lasers.
3. $GFS adding Sivers laser arrays into silicon photonics reference designs and its SCALE CPO platform.
4. Ayar Labs relationship, where Sivers has been working on laser arrays for high-volume optical I/O manufacturing.
5. Ayar also joined NVIDIA’s NVLink Fusion ecosystem and raised $500M to scale CPO volume production, with strategic backing from names like AMD Ventures, NVIDIA, MediaTek and Alchip.
6. Sivers is also preparing for multiple 2027 ramps, while evaluating a Nasdaq New York dual listing.
The important part is not just CPO.
It is that Sivers lasers can matter across pluggables, LRO, LPO/NPO, CPO, external light sources and optical I/O.
That is why I think the market is misunderstanding the story.
When investors see “CPO delay,” they sell laser suppliers as if lasers only matter in one architecture.
But laser demand is spreading across multiple bridge architectures before full CPO scale-up arrives.
TrendForce already says AI data center demand is pushing major players to lock in EML and CW-DFB laser supply.
That is the whole thesis.
If hyperscaler suppliers like Jabil, O-Net, GF partners and Ayar-related ecosystems are moving toward volume, even small design wins can become very material for a company of Sivers’ size.
The near-term watchlist:
1. 1.6T LRO / pluggable volume ramp
2. External light source traction
3. Ayar / optical I/O scale-up
4. GF SCALE reference design adoption
5. 2027 revenue ramps
6. Nasdaq listing progress
7. Potential M&A after better U.S. capital access
I do not think $SIVE becomes the next $LITE just from laser ASPs alone.
To get there, the bigger path is likely lasers + downstream IP + contract manufacturing / optical engine exposure.
But I have not seen many small-cap photonics companies mapped to this many possible hyperscaler supply chains at once.
Disclosure: long $SIVE.
This is the expanded version of ARKK. During a bear market, a single-year 50% drawdown is something you can handle before considering to join. It is not recommended to copy others' strategies. However, you can draw inspiration from the structure and thinking.
I be in the crib away from everybody if you catch me out it’s cause I got tired of being in the house other than that you won’t see me in nobody face fr.