We're open-sourcing Rebalancer, the assignment-problem solver Meta has used for resource allocation across our infrastructure for over nine years.
Given a set of objects and a set of bins, Rebalancer assigns one to the other to optimize your objectives under your constraints, including hardware placement, service and task placement, traffic routing, and more. It separates how a problem is specified from how it's stored, solved, and debugged, with both an optimal MIP solver and a parallelized local search solver.
At Meta it solves ~40 million assignment problems a day across 30+ problem formulations. P99 solve time is 12 seconds on a problem with 265k objects and 3.2k bins.
🔗 Read more on our engineering blog: https://t.co/9D3jAGfOdQ
Finally able to talk about what I've been heads-down on for 6 months at @nvidia 🦀⚡
We just open-sourced cuda-oxide — an experimental rustc backend that lets you write CUDA kernels in pure Rust.
No DSLs. No FFI. No source-to-source step. Single source.
Short🧵👇
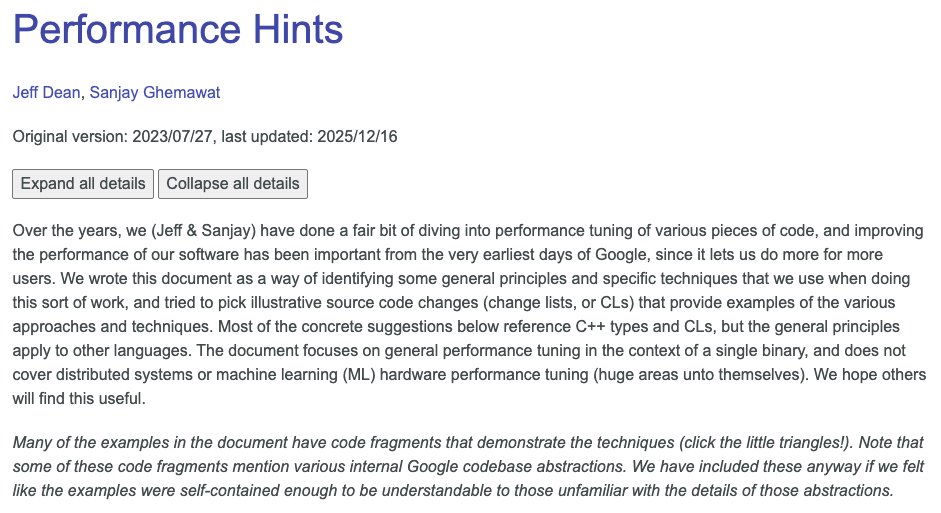
Performance Hints
Over the years, my colleague Sanjay Ghemawat and I have done a fair bit of diving into performance tuning of various pieces of code. We wrote an internal Performance Hints document a couple of years ago as a way of identifying some general principles and we've recently published a version of it externally.
We'd love any feedback you might have!
Read the full doc at: https://t.co/jej95g236P
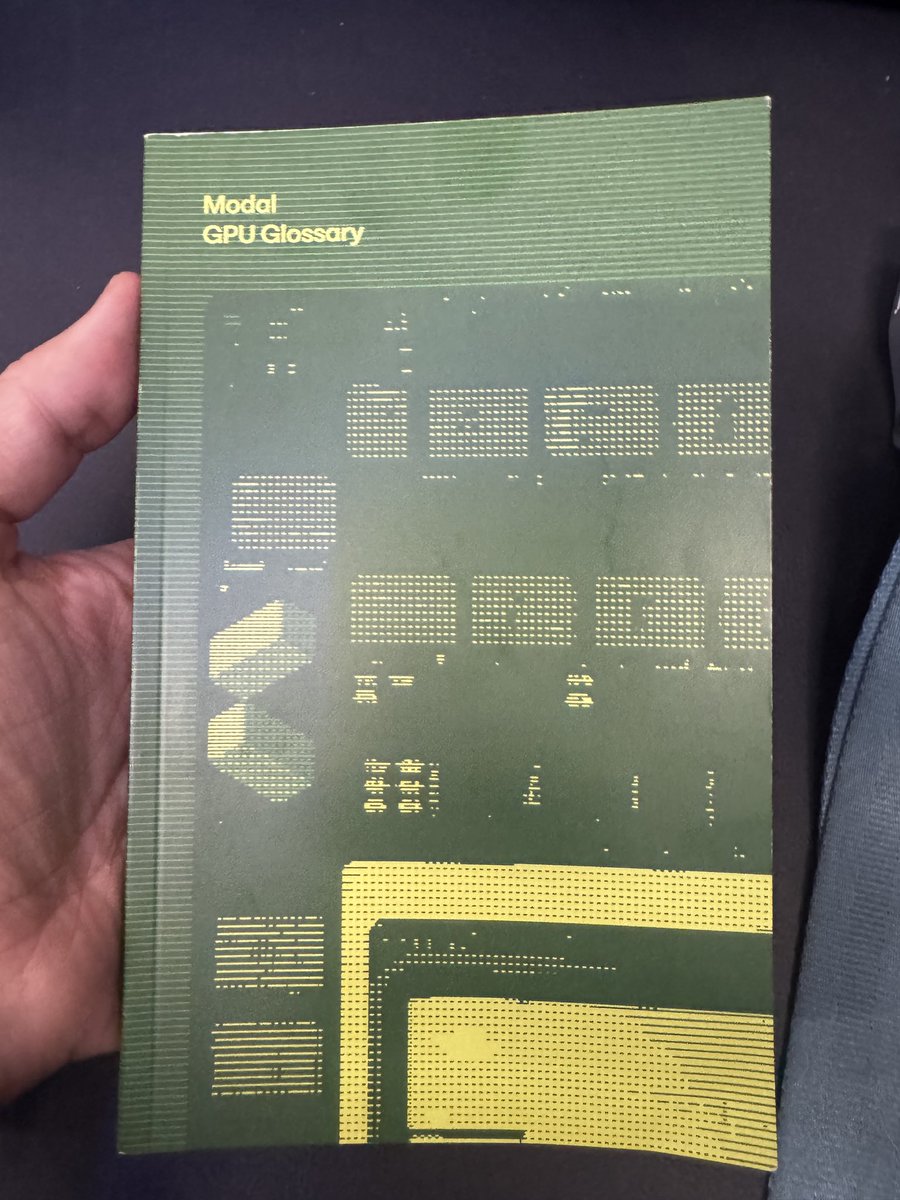
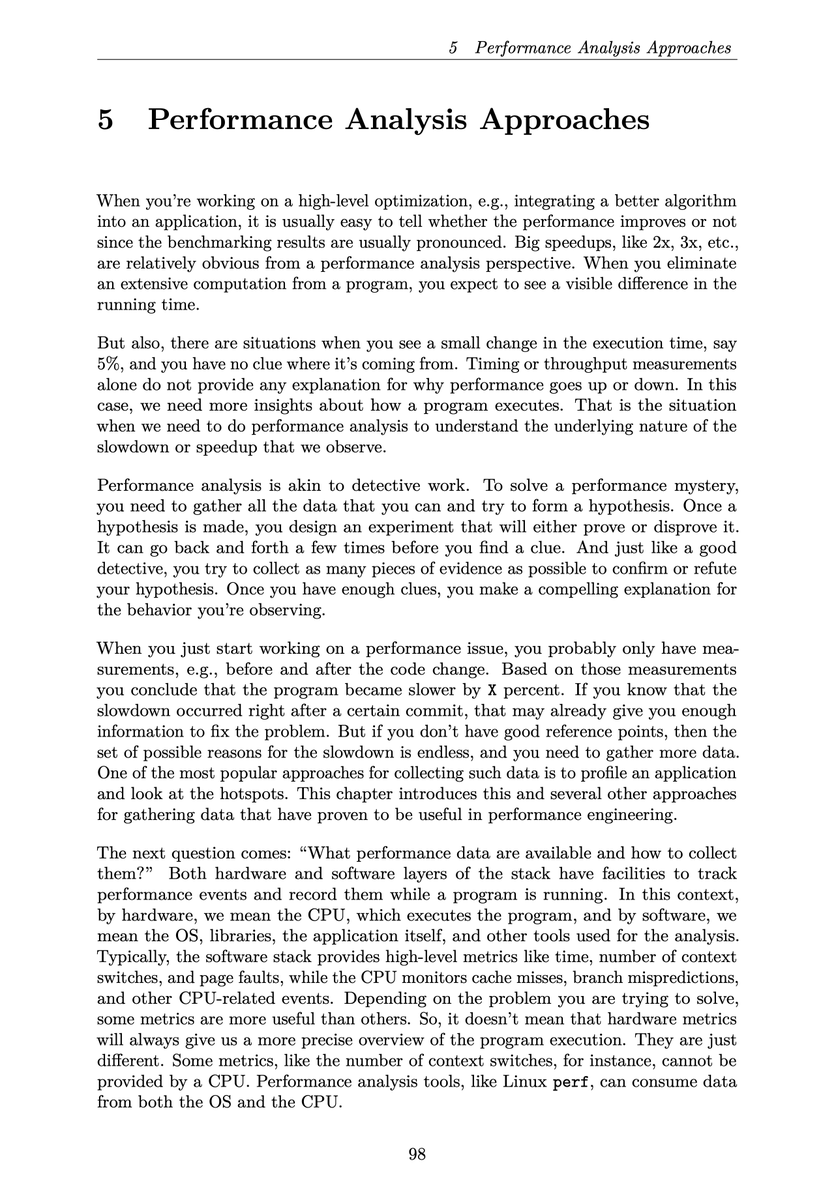
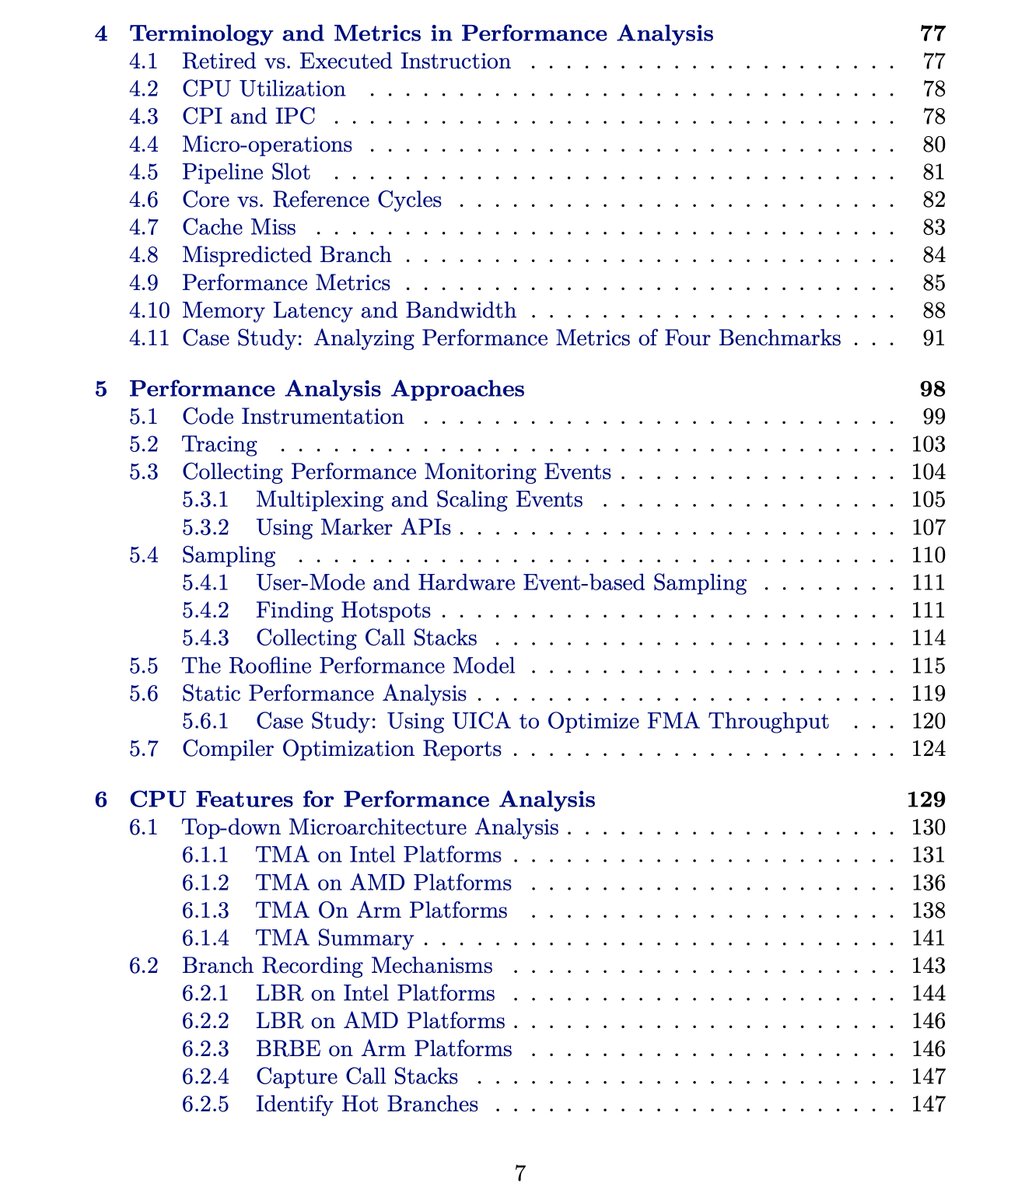
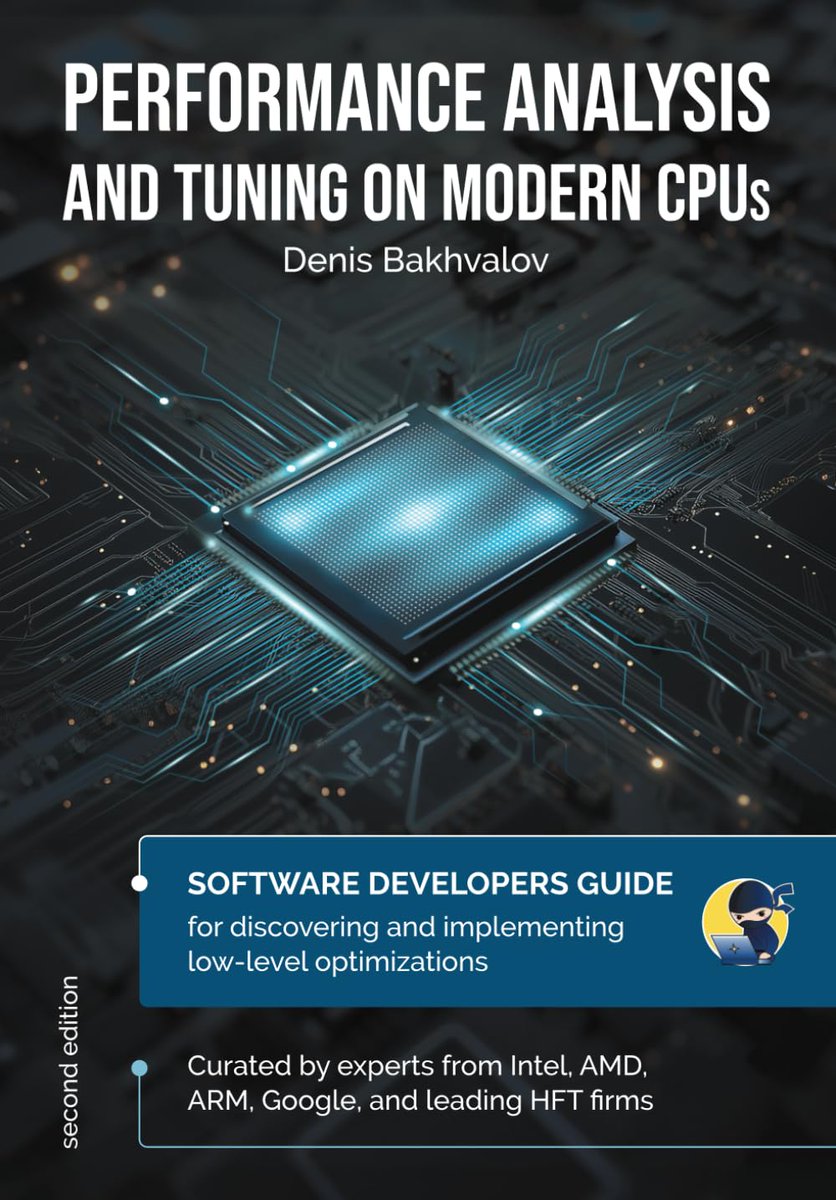
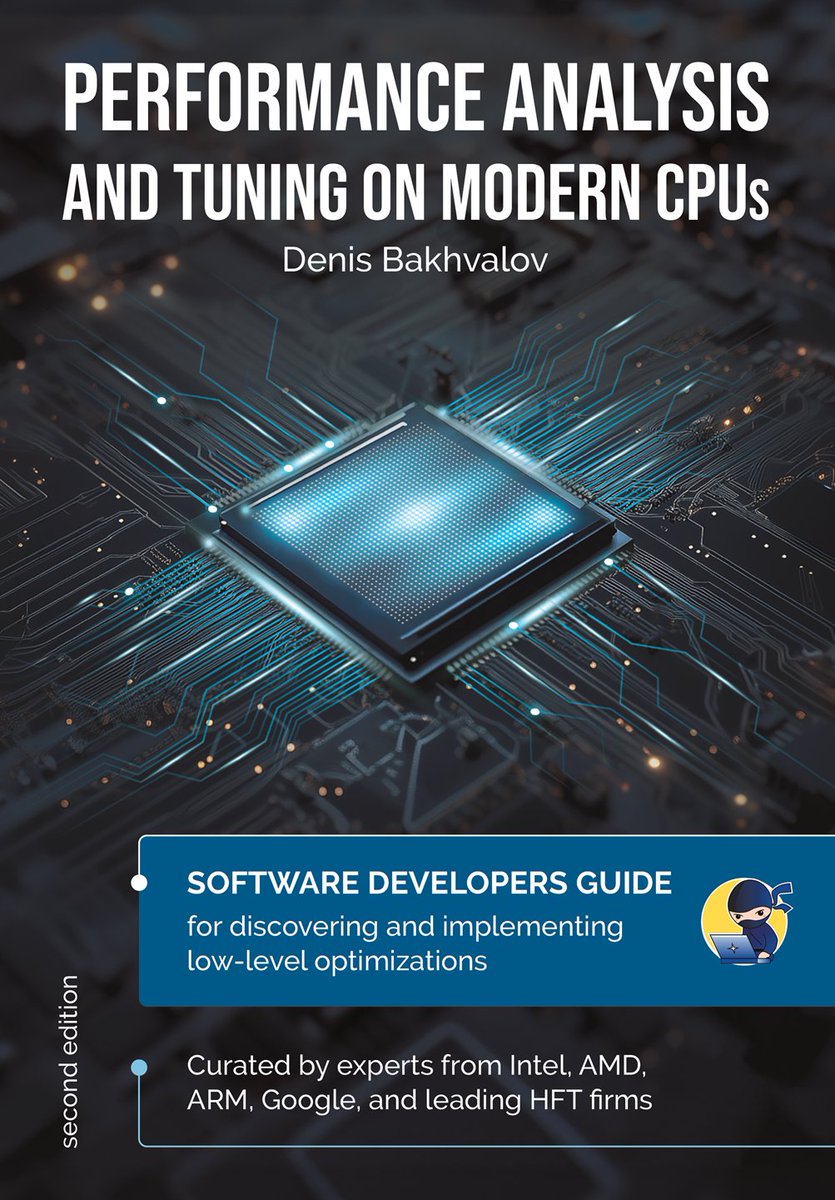
📚 Performance Analysis and Tuning on Modern CPUs by Denis Bakhvalov is a great read in the context of detailed designs of the CPUs.
https://t.co/00n5DtBTd0
In this week's blog post, learn how Java's new CPU-time profiler works internally, including signal handling, queue design, and async sampling: A deep dive into the core components behind the scenes.
Read more at: https://t.co/lvmA8WrjNM
#Java#OpenJDK#JFR#Profiling
Today I stumbled upon a fun paper on system design (from @joy_arulraj): https://t.co/TglMLQrlLm
I shared it on HN under its original title, "A Periodic Table of System Design Principles". But most of the comments ended up debating the name, so the author updated it to "Elements of System Design". Classic HN 😂
As I am preparing my Manning book for production, I discovered I had created a nice Github repository of low latency patterns and resources! Surprisingly handy as latency cheat sheet!
Don't just accept what AI suggests. Ask why. 🤔
The best developers use their curiosity and critical thinking to transform AI suggestions into great code.
Learn why your expertise is more important than ever in the age of AI and how to sharpen your fundamentals for building better software. 👇
https://t.co/oeqHYHDMIR
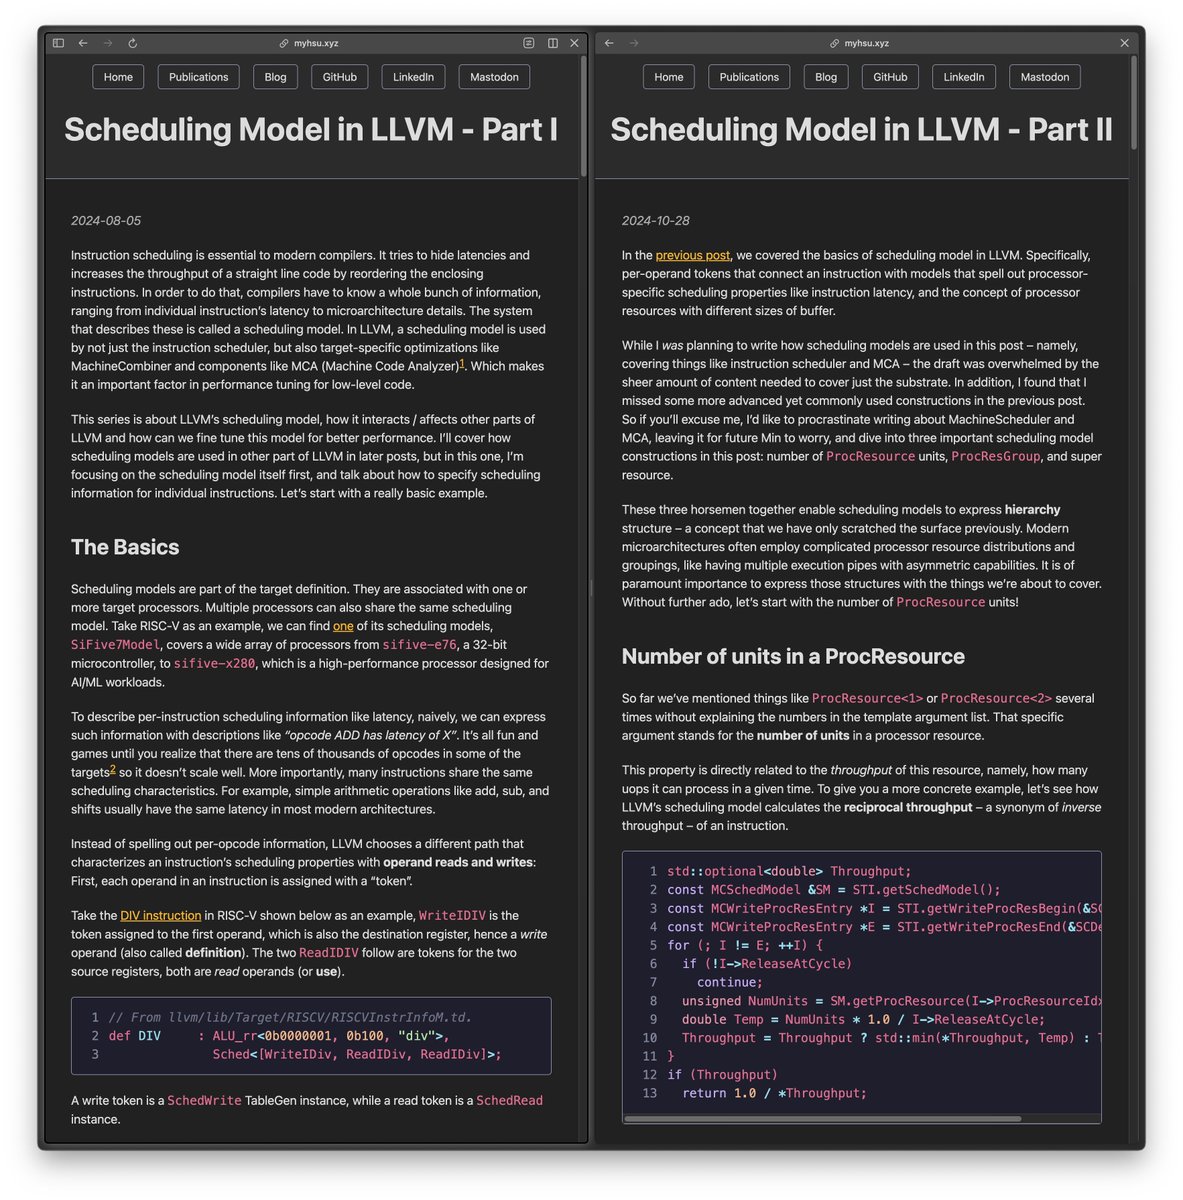
Modern processors rely on instruction pipelines to maximize execution efficiency and throughput, and compilers leverage this to generate optimized machine code.
In a two-part series, @bekket_mcclane focuses on LLVM’s scheduling model, showing how it models latency, throughput, and hardware pipelines to help optimize code performance.
Part 1 - https://t.co/mMLYsajV88
Part 2 - https://t.co/P5nhkllfIo
A conference dedicated to Tracing! Go and explore https://t.co/oGCYAgiu3j
Don't forget to check the past editions section for all the tracing stuff over the years...
Just saw another recommendation for reading clean code to become a rockstar engineer. Honestly, you don’t need to read a book to learn how to write readable code, you'll get there as you grow.
And sure, you can say performance doesn’t matter. But sooner or later, you’ll be working on something where it absolutely does.
When that day comes, you’ll wish you had taken the time to understand the fundamentals that govern performance.
Because if you don’t understand the cost of your abstractions, they’ll end up controlling you more than you control them.
How do processors implement sampling of hardware events for performance monitoring via profilers such as perf?
The specific problem is accurate attribution of the hardware events such as cache or TLB misses to the right instruction in order to help the performance engineers optimize the right code.
It is hard because modern processors issue multiple instructions per cycle. Some of these instructions are fetched speculatively and may not retire if the branch prediction was wrong.
The fetched instructions are broken down into micro instructions which are then executed out-of-order. If a cache miss occurs due to one of these micro ops, it becomes harder to identify the instruction pointer value for which this event occurred.
The default PMU implementation in processors result in a "skid" between the time an event is observed and the value of the instruction pointer. E.g. a cache miss occurred for instruction at address X but the skid makes it the recorded IP value in the profile as X + n, thus introducing inaccuracies.
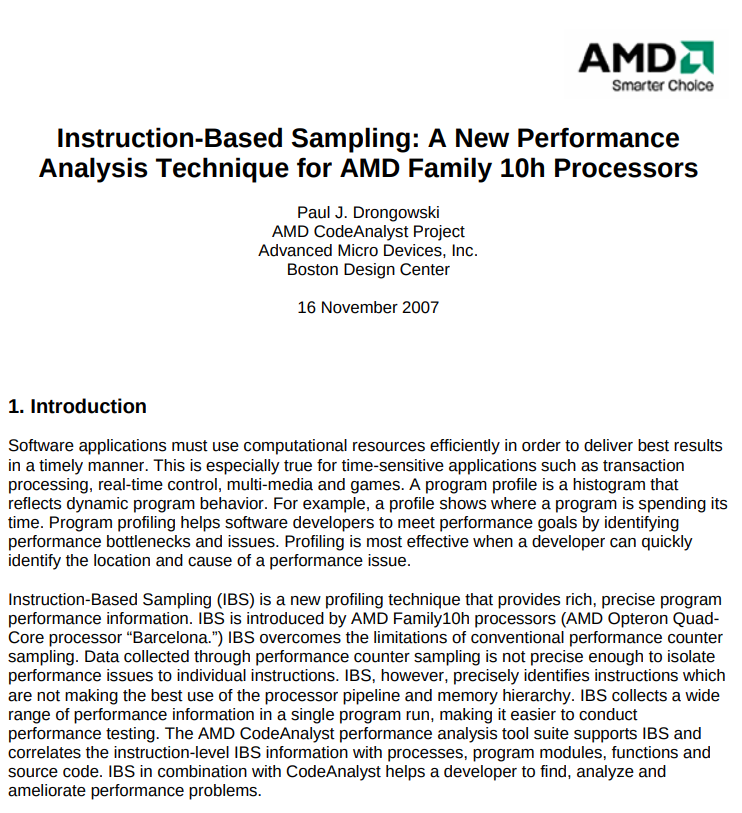
Intel and AMD have their own specialized (and different) event sampling implementations in their processors. The specific sampling technique used in AMD processors is called Instruction Based Sampling.
It breaks down the sampling into two parts, called fetch sampling and op sampling.
Fetch sampling happens at instruction fetch time where a selected instruction is tagged and monitored throughout the pipeline for events such as: instruction completed or aborted, ICache miss, iTLB hit/miss etc.
Op sampling happens in the backend where micro ops are sampled, tagged and monitored for events. Each of these can be accurately pinned to the right instruction in the code, leading to accurate profiles.
The following paper from AMD has the details:
On the 18th of February Christian Terboven (RWTH) and Dr. Michael Klemm (AMD) will present the second part of their OpenMP 6.0 webinar series: "OpenMP 6.0 Part 2: New Device Offloading Features".
To sign up or find out more, go to: https://t.co/c9qmL6el44