For $SNDK, I’m using moomoo less as a “buy/sell” signal and more as a risk-check dashboard.
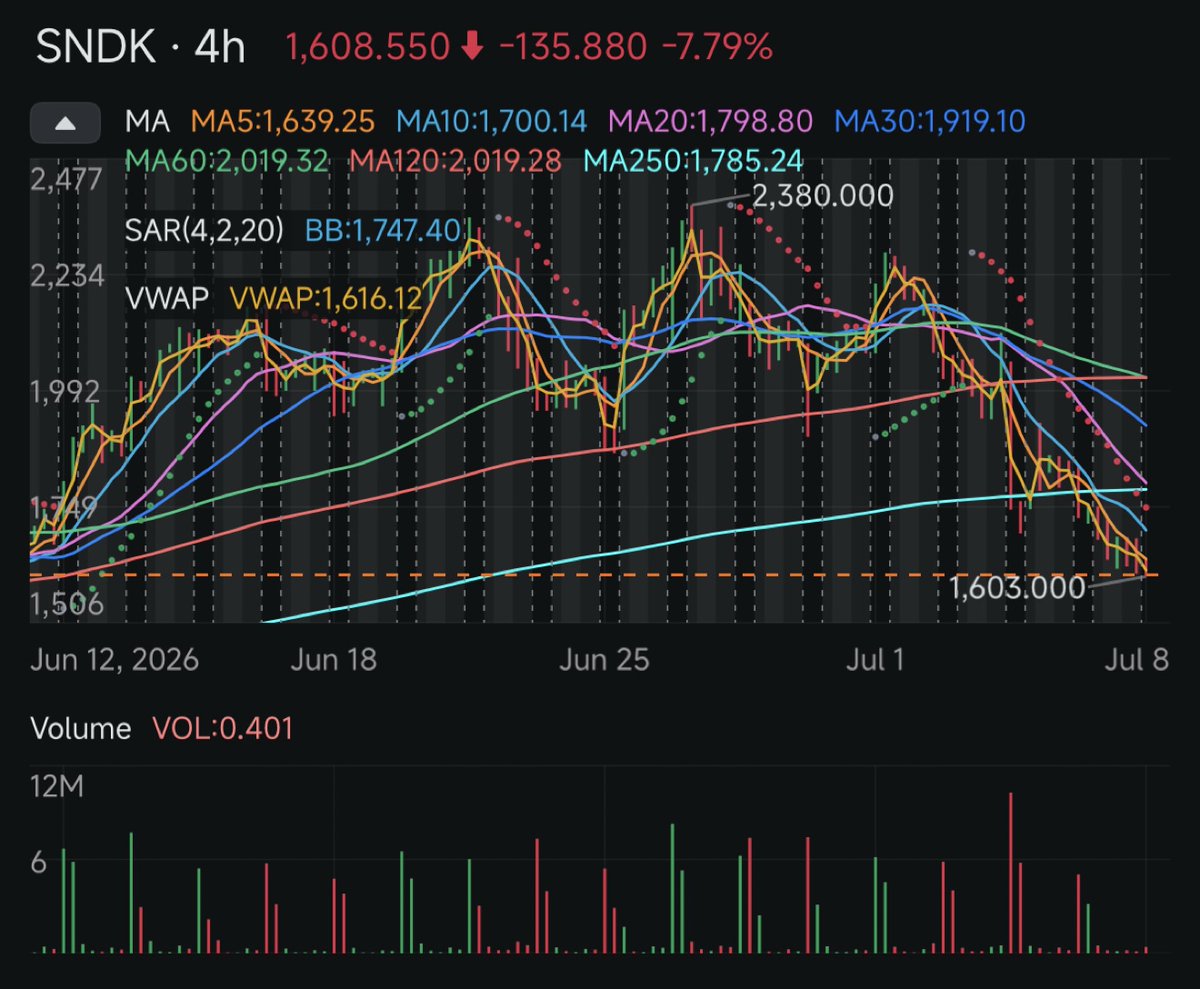
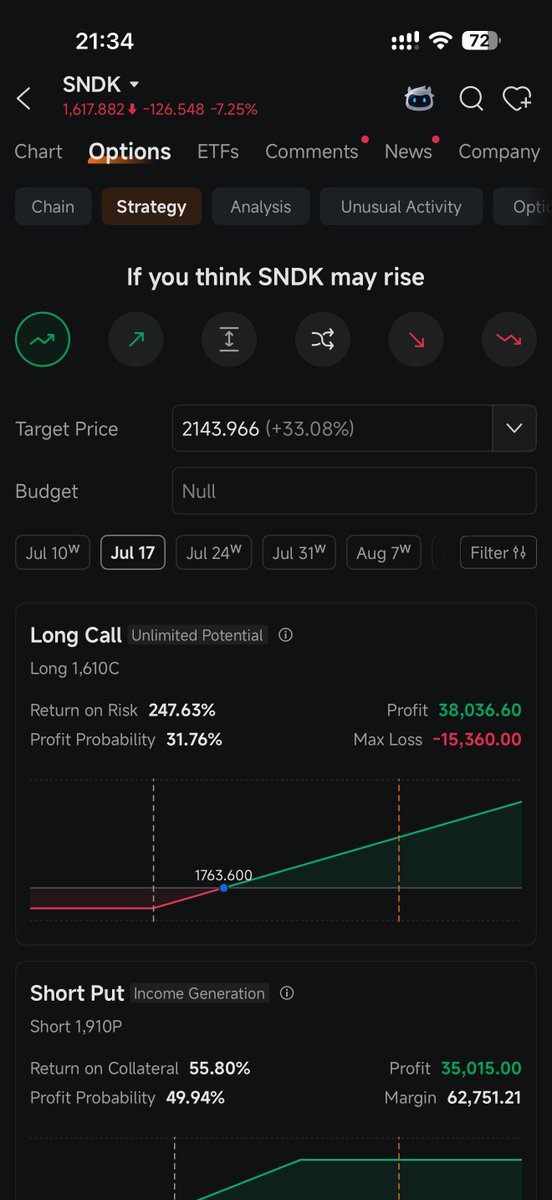
The 4H chart shows a heavy pullback into the 1,603–1,617 area, but the more useful part for me is pairing that with moomoo’s Options Strategy and Earnings Move tools. Options Strategy helps me compare potential upside, probability, max loss, and margin before getting too excited about a rebound setup. Earnings Move adds context by showing how much $SNDK has actually moved around recent earnings versus what was expected.
My read: this dip is interesting, but not clean yet. $SNDK needs to stabilize near this support area before I’d treat the move as constructive. If it reclaims the short-term moving averages, the bounce case gets stronger. If it loses this zone, I’d rather wait than force a trade.
$SKHY 's Nasdaq listing would be interesting too, will see about the impact on $SNDK, $MU and other memory names as well.
Would you play $SNDK through shares, options, or wait for confirmation first?
#moomoo @moomoo
Not financial advice.
I’m using moomoo to track $MU with a 3-part workflow instead of only watching price.
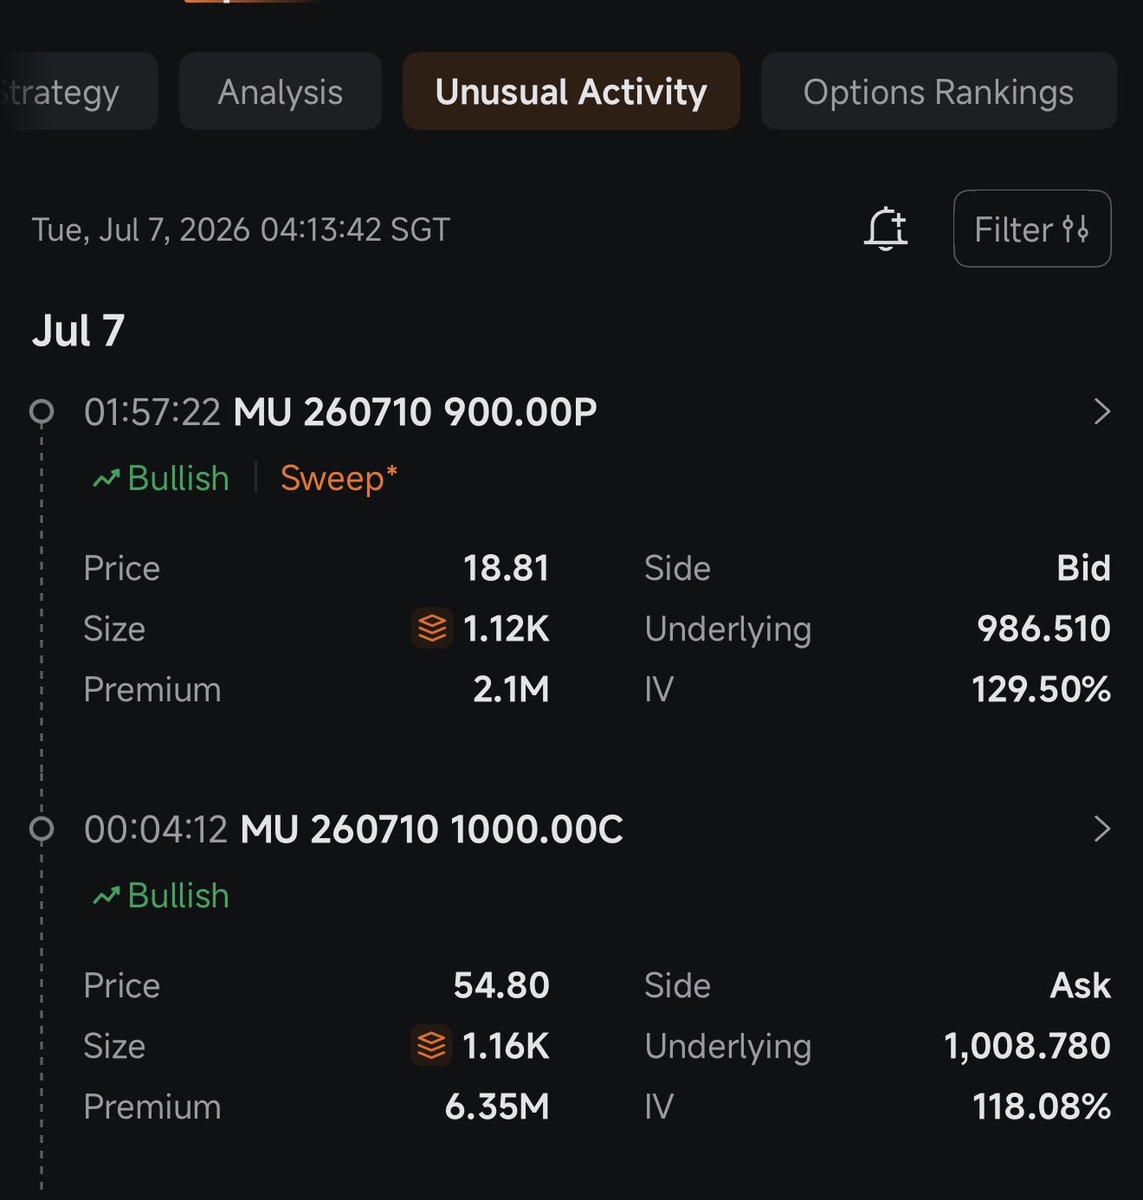
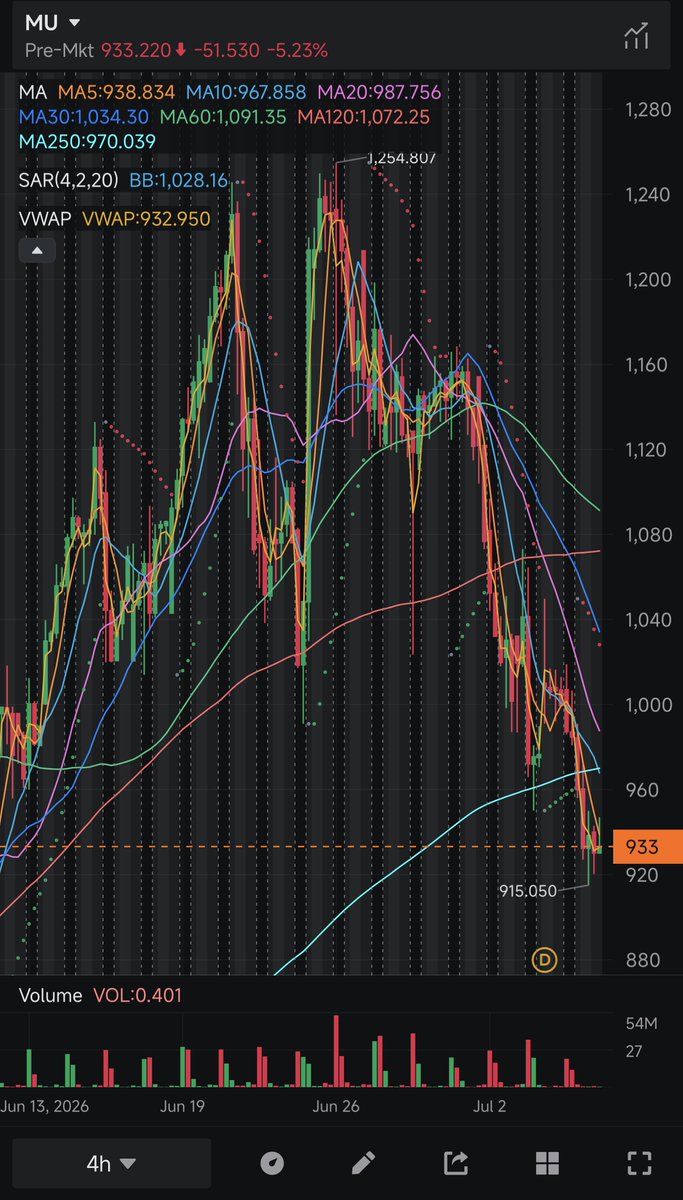
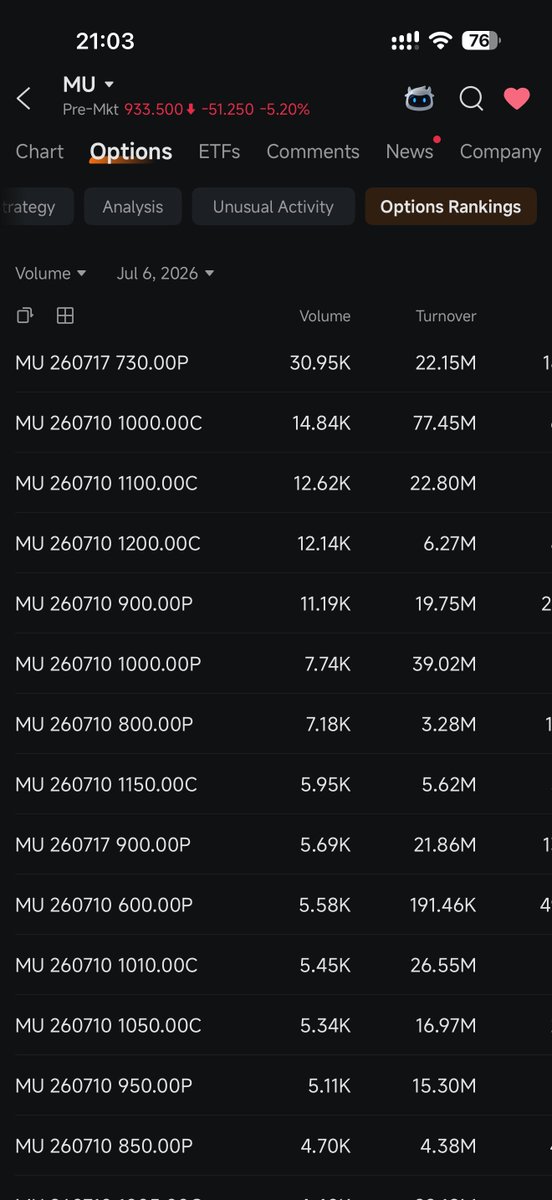
First, I use the 4H chart to mark key zones. Then I check Options Rankings to see where volume/turnover is clustering. After that, I look at Unusual Activity to see whether bigger orders are leaning bullish, defensive, or mixed. What I like is that moomoo lets me connect the chart setup with options positioning in one place.
For $MU, the main level I’m watching is the 915–933 support zone after the pullback from the 1,000 area. If support holds and call flow builds near 1,000 again, that would look constructive. If put flow grows around 900, I’d be more cautious.
Also watching $DRAM $SNDK $SKHY since this is part of the broader memory/HBM/AI server trade.
Would you buy the $MU dip here, or wait for a reclaim of 1,000 first?
#moomoo @moomoo
Not financial advice.
For $SNDK, I’m using moomoo less as a “buy/sell” signal and more as a risk-check dashboard.
The 4H chart shows a heavy pullback into the 1,603–1,617 area, but the more useful part for me is pairing that with moomoo’s Options Strategy and Earnings Move tools. Options Strategy helps me compare potential upside, probability, max loss, and margin before getting too excited about a rebound setup. Earnings Move adds context by showing how much $SNDK has actually moved around recent earnings versus what was expected.
My read: this dip is interesting, but not clean yet. $SNDK needs to stabilize near this support area before I’d treat the move as constructive. If it reclaims the short-term moving averages, the bounce case gets stronger. If it loses this zone, I’d rather wait than force a trade.
$SKHY 's Nasdaq listing would be interesting too, will see about the impact on $SNDK, $MU and other memory names as well.
Would you play $SNDK through shares, options, or wait for confirmation first?
#moomoo @moomoo
Not financial advice.
For $DRAM, I use moomoo as a research cross-check rather than a one-click trade signal.
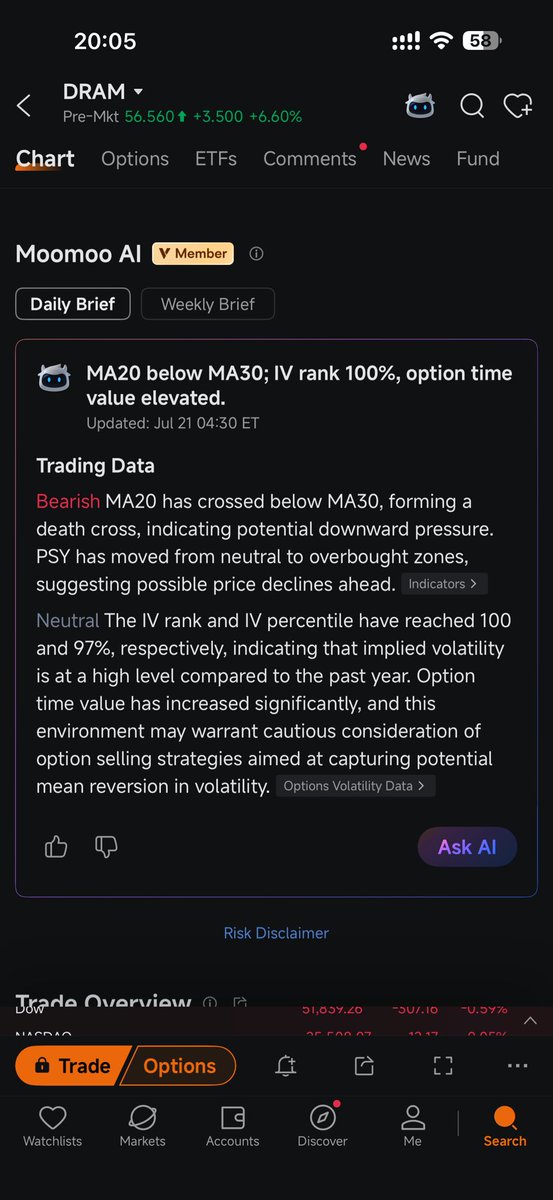
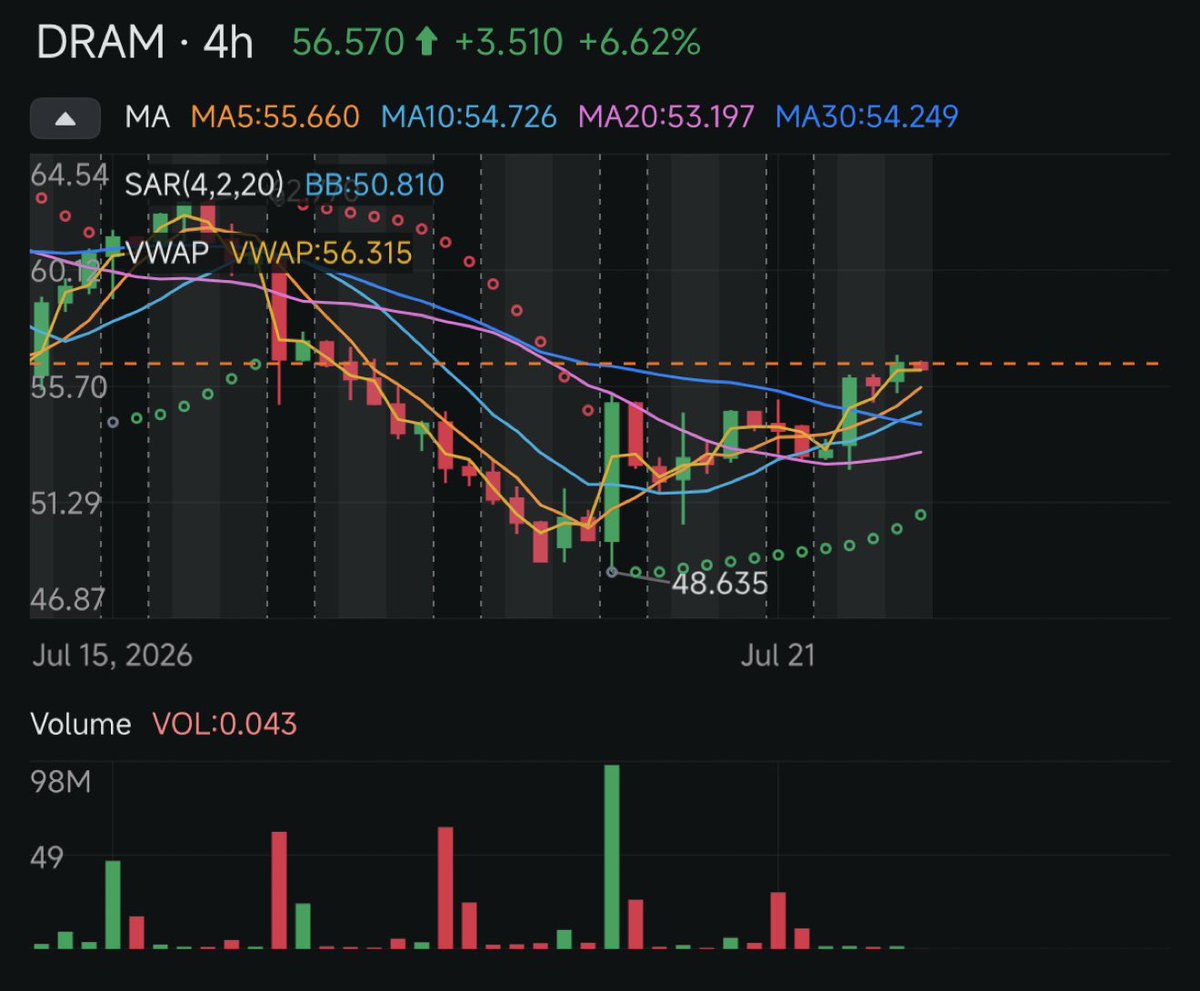
The 4H rebound caught my attention, but the useful part is pairing moomoo AI with Short Sale Analysis. AI summarizes MA20 below MA30, IV rank 100%, IV percentile 97% and elevated option time value. Short Sale Analysis adds daily short activity, including a recent spike near 19% before returning toward average. That’s why moomoo fits my process: summary first, supporting data second.
My read: $DRAM’s rebound from 48.635 to 56.57 looks constructive short-term. Price is above VWAP at 56.315 and the displayed moving averages, but MA20 remains below MA30 and IV is high. I’d want 55.7–56.3 to hold before calling the recovery clean. Short volume is context, not outstanding short interest.
I’d compare $MU, $SKHY, $SNDK and $NVDA to see whether this is stock-specific or part of broader memory/HBM strength.
Which would you weigh more—the AI brief, chart reclaim or short-volume trend—and why?
#moomoo @moomoo
Not financial advice.
@yangtngks Definitely a rough move. I’m cautious for now—the drop weakened the short-term setup, but I’d wait to see if $SKHY can stabilize and reclaim VWAP before making any call.
The reason I use moomoo for $SKHY is that it connects three checks in one workflow. The 2H chart shows VWAP and moving averages; Gamma Exposure maps the Jul 24 gamma flip at 175.29, call wall at 180 and put wall at 150; Trade Stats adds 360.44K options volume and a 0.84 put/call ratio. Having these together makes it easier to cross-check price and options positioning.
For $SKHY, price near 162.3 is above VWAP at 161.365 but below the gamma flip. I’m watching whether it holds VWAP and builds toward 175–180, while 150 remains the lower positioning reference. The 0.84 ratio shows slightly more call than put volume, but it isn’t a directional signal by itself.
That’s why moomoo fits my process: chart structure, gamma levels and options activity are connected in one place. I’d compare the same signals across $MU, $SNDK and $NVDA to see whether the move is isolated or part of the broader memory/HBM/AI trade.
Would you focus more on the VWAP hold or the 175–180 area here, and why?
#moomoo @moomoo
Not financial advice.