The people who feel the urge to do something every single day are the same ones who give back a months worth of progress during a pullback/consolidation.
"Everyday is a day to lose money, but not everyday is a day to make money" @Qullamaggie
3 ways to find the strongest stocks!!
My general rule for portfolio construction is ~90% allocation in leaders (relative strength, holding highs, clean trend), and ~10% in contrarian bets (hated, under-owned, fallen out of favor).
It's way more likely that strong stocks will continue to get stronger, than for weak stocks to get strong.
3 ways to find the leaders:
1)
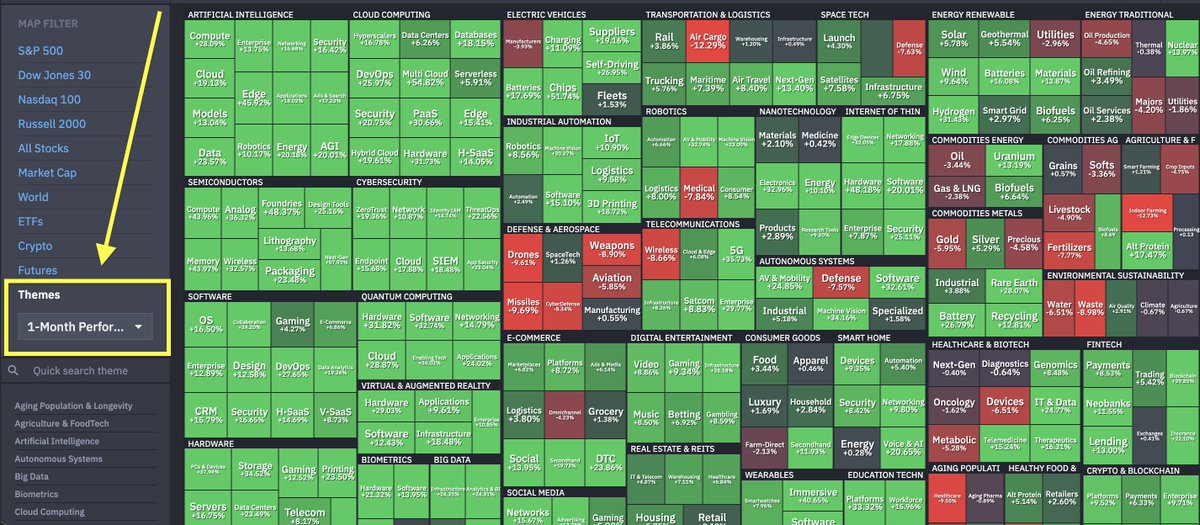
> go to finviz -> maps
> click themes on the left
> filter to 1 month
> see strongest theme
> click into theme to find strongest individuals names
> add to watchlist
2)
> scanner (can keep it simple)
> scan for stocks making new 52 week highs (or within ~5% of highs)
> over key moving averages
> with good volume confirming the move
> best if it's been a somewhat steady move up
> also can just use ETFs to monitor sector strength like I talked about yesterday
3)
> use a prompt (perplexity, claude, chat)
> type:
- find me US stocks showing the strongest relative strength right now. Focus on stocks near 52 week highs, above the 20/50/200 day moving averages, with strong volume, clean uptrends, and leadership within strong sectors. Exclude low float junk and illiquid names.
This is NOT a "buy at insane extended moves" though...this is about monitoring strength, seeing where money is flowing, and making a plan to join the trend.
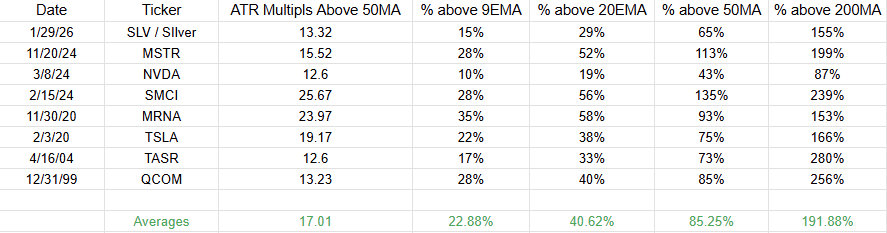
Many people been reached out asking about parabolics on $SNDK $MU $INTC etc.
Here is a small database I did a while back studying some prior big cap parabolic reversals. Studied their ATR multiples from 50MA the day before the peak as well as the % extension above specific moving averages
ATR multiples above the 50MA from @jfsrev beat simple percent gains because they adjust for the stock's unique volatility. That is what I like to focus on the most. Helps reveal true overextensions in parabolic moves that just straight up percentages often mislead imo.
The average ATR multiple above 50MA on these listed is 17x and that is BEFORE the climax day, some have hit highs of 25-30x the day they peak.
$SNDK is only sitting at 11.35x as of the close, notably below the average. It also is below average for all of the % above MA readings besides 200ma.
These names can get much more extreme than you think. You need strict criteria for these setups or it's a waste of time.
Came across this document of Qullamagi’s 2020–2021 trade positions.
If you go through these trades, one of the best things you’ll notice is the risk–reward. There a lot of losing trades. But the losses are not big, mostly around one or two X.
On the other hand, the winning trades are much bigger.
If you go through the stock names, try to understand the thought process behind each trade.
Yes, this is from 2021, but a lot of things can still be understood today if you go through these trades.
Go through it. Try to understand it. Good luck.
Link - https://t.co/7Yl0qzb1AW
@lqtyprovider@DomenicIandolo Then what is point of HoldCo 🤔 You can invest & generate profits in the operating company itself and its the same taxation?
Created https://t.co/YDeZTl9xRM
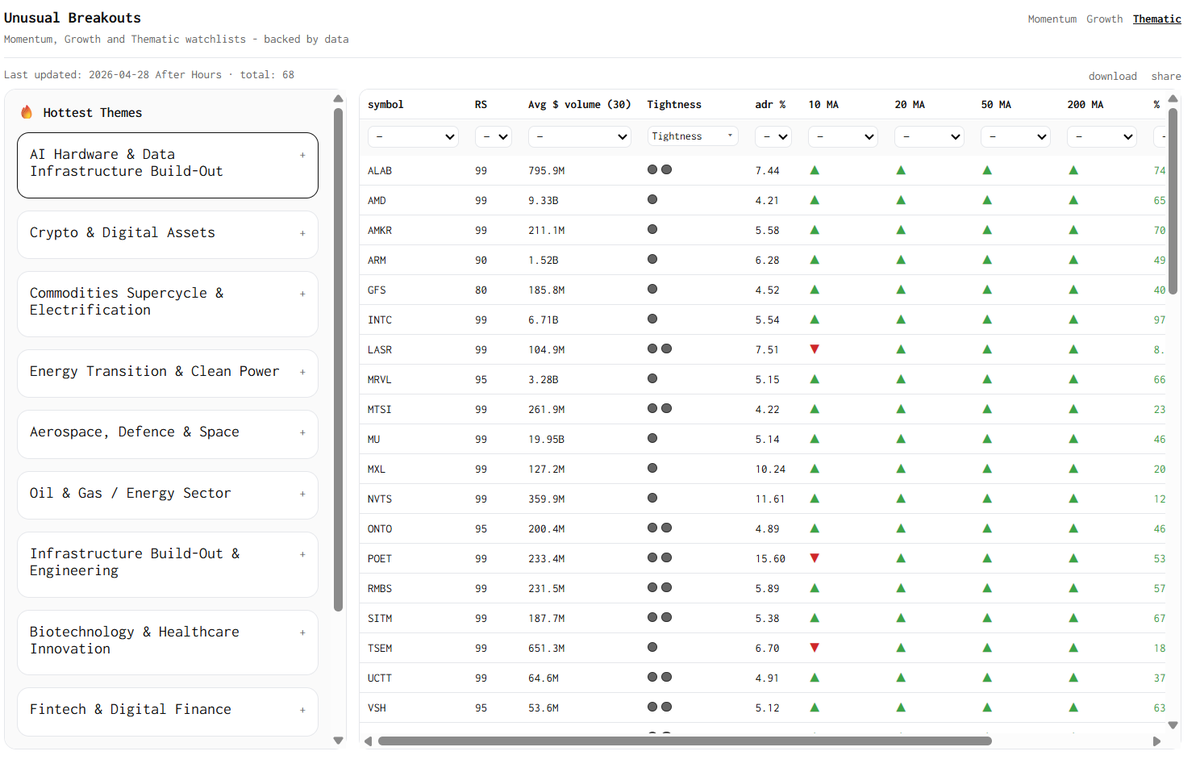
Automatically generating momentum, growth (CANSLIM) and thematic lists for breakout trading.
Momentum lists generation process is backtested since 2007.
Filter for most liquid, highest ADR and tight bases for best candidates.
Let me know what you think
@TejwantB @RentYourStocks Just my thought process - I think there were lot of open puts positions around 200 ~ 3k. It closed at 204 at the end of the regular trading hours. I am thinking it will sell off again on Monday going into earnings. There might be an initial push higher.
@TejwantB @RentYourStocks Its trickier to predict when they will unload. They will want to make some money out of this move but the Avis execs are ex SRS or related so we never know.
@RealSimpleAriel@Avis They won't because everyone is with the SRS investment side. CEO is ex-SRS investment board member. They wont do anything thay affects the profit of SRS.
In light of all of the recent gaps higher in stocks, I’ve been thinking about episodic pivots, a trading strategy used by @Qullamaggie which he credits @PradeepBonde with inventing. As backstory, episodic pivots, as I understand them, come when a stock gaps higher on some news specific to the stock. This is news that caught the market off guard as evidenced by the price gap higher. These gaps tend to be somewhat rare especially among larger stocks. So when I saw dozens of gaps pop up on my screener, I was somewhat surprised as this hasn't happened in the few years I've been watching. Clearly Iran was the driver of these price gaps but this all made me wonder how the two guys who know the most about episodic pivots think about gaps that are driven by macro factors as opposed to idiosyncratic stock happenings. Maybe they will comment, hence tagging them.
Israel loses 22% of its computer science PhDs abroad. They call it a national emergency. The Knesset debates it. Newspapers run it front page.
Canada loses 71% of Waterloo's best engineers. Nobody blinks. Nobody even notices! Shrug.
Same problem. 4x worse. Zero urgency.