GeoLibre now works without the internet!
The newest addition lets you extract your own basemap out of the global Protomaps planet build and take it with you. Open Project > Offline Basemap and you can:
- Extract any area: draw a bounding box on the map (or use the current view), pick a zoom range, and GeoLibre copies just those tiles out of the 127 GB remote archive using HTTP range requests.
- Get a real basemap: the extracted archive is styled with the Protomaps basemap schema with five flavors (light, dark, white, grayscale, black).
- Stay offline for real: the fonts and icons are bundled with the app, so your basemap renders fully with no network connection at all.
- Keep a library: saved basemaps live in a panel where you can rename them, switch flavors on the fly, re-apply them later, or open any local .pmtiles file straight from disk.
- Point at any archive: paste any .pmtiles URL into the Basemap Picker or the New Project dialog and style it as a basemap on the spot.
The result is a portable .pmtiles file: one self-contained file that holds your study area and travels with you. Whether you are heading into the field with no signal, working from a plane, running a workshop on a locked-down network, or just tired of waiting on tile servers, your basemap is now a file you own.
Try it out
- Launch GeoLibre Web: https://t.co/8gMtkVtfnm
- GitHub: https://t.co/VXq8c1o2Nd
- Documentation: https://t.co/7VA2AQoCUc
Big thanks to the Protomaps project for the PMTiles format, the open basemap schema, and the daily planet builds that make this possible.
#GIS #Geospatial #OpenSource #PMTiles #Protomaps #MapLibre #GeoLibre
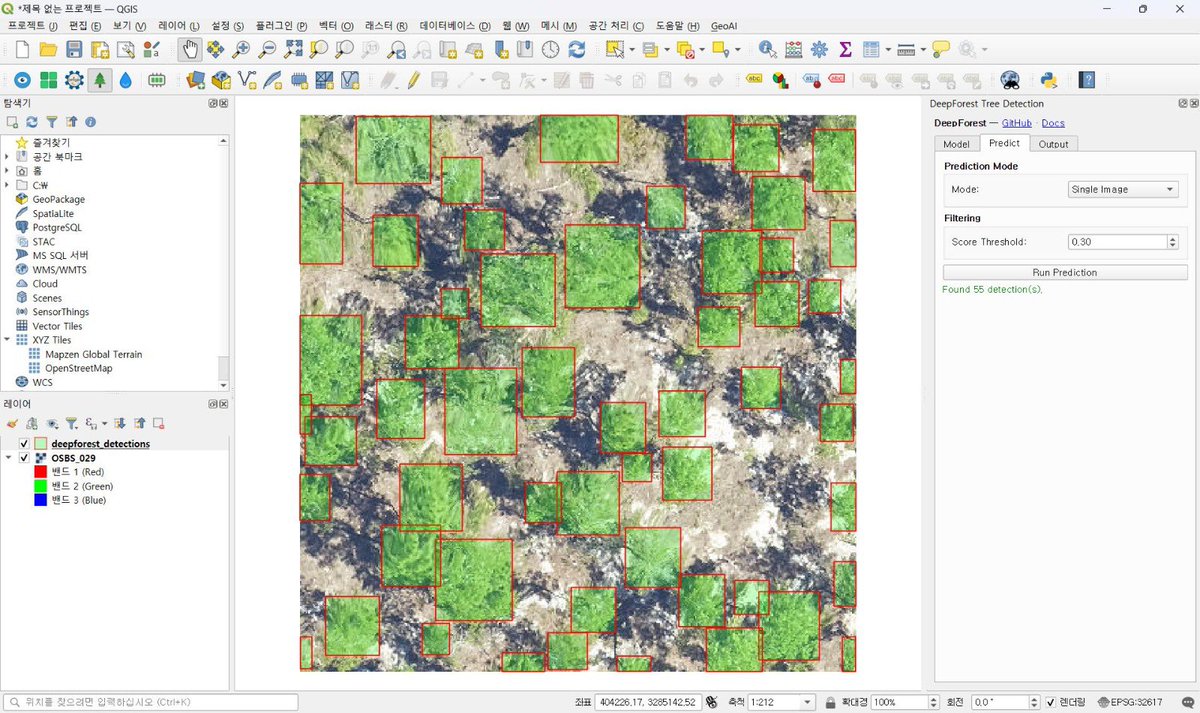
The New GeoAI QGIS Plugin: Bringing Advanced AI to Every GIS Professional
Artificial Intelligence is rapidly becoming an integral part of everyday GIS workflows, and one of the most exciting recent developments is the GeoAI plugin for QGIS. Officially available through the QGIS
Google has lost the browser war and nobody told them yet.
An ex-Google engineer open-sourced a privacy-first browser with a native AI agent, MCP server, scheduled tasks, and 40+ app integrations.
Free, private, and it can run entirely on local models.
What's inside:
→ 53+ browser automation tools you control with natural language
→ Built-in MCP server, drive the browser from Claude Code or Gemini CLI
→ Cowork mode: agents that read the web AND write to your local files in the same task
→ Scheduled tasks that run agents on autopilot, hourly or daily
→ BYO Claude/GPT/Gemini keys, or run Ollama locally
→ 40+ app integrations: Gmail, Slack, Notion, Linear, Figma, Salesforce
→ 10x more ad blocking than Chrome
Ask it to book flights, fill forms, research anything, it does it live in your browser.
It's a real Chromium fork with the agent loop baked into the browser process itself. Chrome literally can't ship this without competing against its own ad business.
Imports every Chrome bookmark, password, and extension in one click.
100% open source. runs 100% locally.
Learn algorithms visually!
interactive visualizations that actually make concepts click, Prim's, Dijkstra, sorting it's all here and stupidly satisfying.
Live visualizations & code then instant understanding.
tool - https://t.co/u7w5K8oqs9
8 Deployment Patterns developers should know:
1) 𝗥𝗼𝗹𝗹𝗶𝗻𝗴
↳ Gradually replaces old instances with new ones. Useful for reducing downtime, but old and new versions may run at the same time.
2) 𝗕𝗹𝘂𝗲-𝗚𝗿𝗲𝗲𝗻
↳ Keeps one live version and one idle candidate version. Once the new version is validated, traffic switches from blue to green.
3) 𝗖𝗮𝗻𝗮𝗿𝘆
↳ Releases the new version to a small percentage of users first. If metrics look healthy, the rollout expands.
4) 𝗙𝗲𝗮𝘁𝘂𝗿𝗲 𝗙𝗹𝗮𝗴
↳ Deploys code while keeping the feature hidden or disabled. This separates deployment from user exposure.
5) 𝗣𝗿𝗼𝗴𝗿𝗲𝘀𝘀𝗶𝘃𝗲
↳ Combines gradual rollout, metrics, feature flags, and automated decisions to increase exposure only when the release looks safe.
6) 𝗦𝗵𝗮𝗱𝗼𝘄
↳ Sends real production requests to the current version, while copying those requests to the new version for observation.
7) 𝗔/𝗕
↳ Sends different user groups to different versions so teams can compare behavior, performance, or product outcomes.
8) 𝗜𝗺𝗺𝘂𝘁𝗮𝗯𝗹𝗲
↳ Deploys the new version to fresh infrastructure instead of modifying existing instances in place.
Each pattern moves risk to a different place. There's no single best one. The choice depends on what you are trying to protect: availability, user experience, data compatibility, rollback speed, or operational simplicity.
But how do these patterns actually work under the hood? To see how, subscribe to receive our 𝗗𝗲𝗽𝗹���𝘆𝗺𝗲𝗻𝘁 𝗣𝗮𝘁��𝗲𝗿𝗻𝘀 𝗗𝗲𝗲𝗽 𝗗𝗶𝘃𝗲 when it's released in a few weeks → https://t.co/oCWjbQgRhU
What else would you add?
——
🔖 Save for later.
♻️ Repost to help others learn deployment patterns.
➕ Follow me ( Nikki Siapno ) + turn on notfications.
An 82K-star GitHub repo is built around one painfully obvious idea:
Your coding agent should map the codebase once, not grep it forever.
Graphify turns an entire project into a queryable knowledge graph.
Functions, classes, files, SQL schemas, infrastructure, docs, PDFs, images and videos become connected nodes that an agent can traverse instead of repeatedly opening files and reconstructing the architecture.
So instead of:
→ search for authentication
→ open twelve files
→ follow imports manually
→ lose the trail as the context fills up
The agent can ask:
> What connects authentication to the database?
> Trace the path from UserService to DatabasePool.
> Explain RateLimiter.
> Which concepts does everything flow through?
Graphify returns the relevant subgraph and the path connecting the concepts, not another list of keyword matches.
For source code, this is not RAG:
→ No embeddings
→ No vector database
→ No LLM required
→ Code is parsed locally using tree-sitter
→ Calls, imports and inheritance become graph edges
Every relationship is also marked as EXTRACTED, INFERRED, or AMBIGUOUS, so the agent can distinguish what exists explicitly in the source from what Graphify resolved or guessed.
The cleverest part is what happens next.
Graphify can install hooks or persistent instructions for Claude Code, Codex, Cursor, Gemini CLI, Copilot and 20+ other assistants.
Before the agent starts blindly grepping or reading files one by one, it is nudged to query the existing graph first.
The graph can be committed to Git, automatically rebuilt after commits, shared across the team and exposed through MCP.
Long context windows help agents read more code.
A persistent knowledge graph helps them know where to look.
The next improvement in coding agents may not come from stuffing more files into the prompt.
It may come from making them stop rereading the repository.
Here's the GitHub Repo: https://t.co/4ify3X8urp
Google just dropped a 1-hour course on agentic engineering from scratch:
00:00 - Build your first AI agent
08:24 - Give your agent real memory (short, persistent, long)
28:34 - Agentic loops that run for hours on their own
40:04 - Build your own MCP (MCP VS API)
1:00:22 - Wire up multi-agent systems
72 minutes and you'll understand agents better than most people building them.
Watch it today, then read the step by step guide for beginners on building loops below.
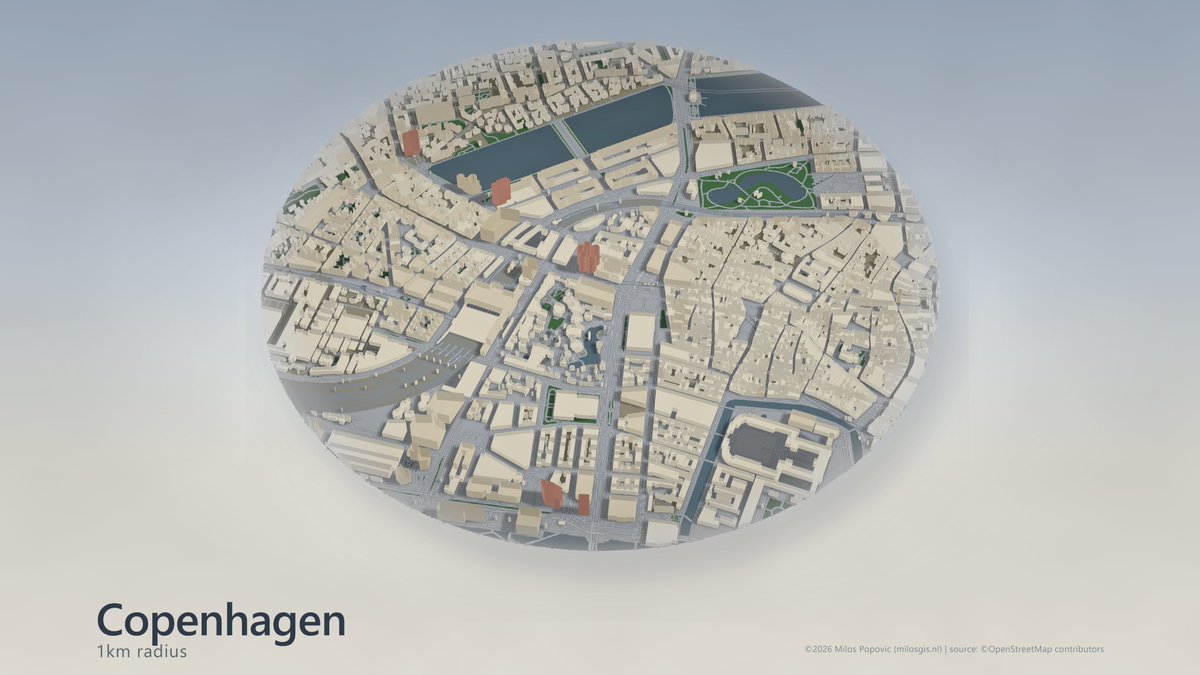
forge3d leverages 3 methods to render beautiful maps from OpenStreetMap data
1️⃣ CPU software raster (oblique). Limestone height tiers, golden-hour warm/cool grade, per-building tone variation, hand-built soft shadows + contact AO. Total control, fully deterministic. ~4 min for an 8K plate.
2️⃣ GPU viewer (oblique). Real-time rasterizer: PCSS 4096 soft shadows, MSAA 8, image-based lighting, tilt-shift DoF. Same scene, ~1–2 min. The fast path — and the one you can fly a camera through.
3️⃣ Path traced (nadir relief). Here the footprints become an extruded heightfield and a path tracer computes real global illumination — soft, sky-lit street shadows no hillshade can fake. Slowest to render, but the light is physically true.
Which look wins for you?
Ex google engineer acaba de soltar un curso completo de 1 hora para construir agentes de IA que se mejoran solos, desde cero:
00:00 – Cómo nace un agente que se construye a sí mismo
03:01 – soul.md: el archivo que lo controla todo
30:16 – RAG inteligente: solo traes 20 mensajes relevantes, no los 2.000
31:48 – El loop que sabe cuándo parar solo
35:14 – Detectar el error y arreglar el prompt en el momento
50:22 – Cómo Claude comprime y optimiza tu memoria automáticamente
1 hora de contenido práctico que vale más que la mayoría de cursos de pago sobre agentes.
Míralo completo, guárdalo📚
Planetary Mapping in the Browser with GeoLibre!
Web mapping just left Earth orbit. GeoLibre, the open-source cloud-native GIS platform, now maps nine more worlds beyond Mars and the Moon:
- Mercury
- Venus
- Io, Europa, Ganymede, and Callisto (Jupiter's Galilean moons)
- Titan (Saturn's largest moon)
- Pluto and Charon
You can browse each one right in your browser, with no install required.
A few things I'm excited about under the hood:
The imagery comes from USGS Astrogeology, which publishes these mosaics only in an equirectangular projection. MapLibre renders Web Mercator, so GeoLibre reprojects each tile to Web Mercator on the fly at the edge, with no pre-processing and no giant downloads.
Every body carries its own radius. Switch to the Moon or Pluto and your distance, area, and scale-bar measurements use that world's geometry instead of Earth's, so the numbers are actually right.
A planet switcher in the Layers panel lets you hop between Earth, the Moon, Mars, and the rest with one click.
Whether you are teaching planetary science, prototyping a mission map, or just curious what Titan looks like next to a scale bar, it is all a click away.
Try it out:
- Launch GeoLibre Web: https://t.co/8gMtkVtfnm
- GitHub: https://t.co/VXq8c1o2Nd
- Documentation: https://t.co/7VA2AQoCUc
Thanks to USGS Astrogeology and OpenPlanetaryMap for making this data open.
#GIS #OpenSource #Geospatial #PlanetaryScience #MapLibre #WebGIS #GeoLibre #Astronomy
I am happy to announce our new course "Cloud Native Remote Sensing with Python". It is a comprehensive guide for working with Earth Observation data using a completely open-source stack. More than a year in the making, we are glad to finally release it to the world.
(1/n)
Geospatial models has a strange problem. It can recognise a house in one crop, then forget the road network around it a few kilometres later.
That’s because most remote sensing models are still built around small image tiles. They label patches of land, one crop at a time. A building is a building. A road is a road. A field is a field.
But satellite imagery doesn’t work like a folder of neatly cropped photos. It comes as huge scenes covering hundreds of square kilometres, where the meaning of a pixel often depends on what surrounds it.
A narrow strip of water could be a river, canal, drainage channel, or pond edge. A pale rectangle could be a roof, greenhouse, road surface, or bare ground. The local texture gives clues, but the wider geography often gives the answer.
This creates a bit of a trade-off.
Use small crops and the model keeps sharp detail, but loses context. It can see the road surface, but loses the road network. It can label water pixels, but loses the shape that tells you whether it’s a pond, river, lake, or canal.
Use the full image and the model gets the broader scene, but fine detail gets compressed. Narrow roads blur. Small buildings disappear. Boundaries get messy.
A new paper from Beihang University and NTU tries to solve this with SFR-Net, a model for ultra-wide area remote sensing segmentation.
The core idea is pretty simple: make the model look at the same place from multiple “altitudes” at once.
For each target area, SFR-Net creates three aligned views. A local view for fine detail. A short-range view for nearby context. A long-range view for the wider landscape.
All three are centred on the same location. The model isn’t stitching together random tiles. It’s building a stack of views around one place, closer to how a person might move between a drone image, a city map, and a regional map.
The authors call this a scale-frustum representation.
Then the model fuses the views in stages. First, the local view absorbs nearby context. Then that richer view absorbs the broader scene. Instead of choosing between detail and context, it builds from one into the other.
The results are meaningful.
On GID, SFR-Net reaches 74.67% mIoU and 86.94% overall accuracy, beating the previous best by 1.72 percentage points in mIoU.
On FBPS, the harder dataset with 24 fine-grained land-cover classes, it reaches 77.24% mIoU and 92.91% overall accuracy. That’s a 4.29 point mIoU gain over the previous best.
That second result is the more interesting one. Fine-grained land-cover mapping is where the confusion gets worse: river versus pond, road versus bare ground, small building versus surrounding urban fabric.
The model improves most where geography starts doing the work that texture can’t.
Remote sensing models have borrowed heavily from normal computer vision. That helped the field move fast, but aerial imagery has a different structure. Roads, rivers, forests, cities, and fields are spatial systems. Their meaning depends on scale, shape, continuity, and surroundings.
คำศัพท์ AI เยอะจนตามไม่ทัน? TechCrunch ทำ glossary สรุปคำสำคัญ เช่น hallucination, AI agent, model และ training data
บทเรียน: ใช้ AI ให้เก่งขึ้น ต้องเข้าใจภาษาของมันก่อน #SanookAi
https://t.co/DQ7MmEU2UX
GeoLibre now supports rendering 3D Tiles!
Try it out: https://t.co/YdRkXuhvUO
GeoLibre is a lightweight, cloud-native GIS platform for visualizing, exploring, and analyzing geospatial data across desktop, mobile, and web environments.
GitHub: https://t.co/VXq8c1o2Nd
Website: https://t.co/7VA2AQoCUc
#geospaptial #opensource #maplibre #GeoLibre