𝗘𝗮𝗿𝗻𝗶𝗻𝗴𝘀 𝘀𝗲𝗮𝘀𝗼𝗻 𝗶𝘀 𝗵𝗲𝗿𝗲, 𝗮𝗻𝗱 𝘁𝗵𝗲 𝗯𝗶𝗴𝗴𝗲𝘀𝘁 𝗺𝗮𝗿𝗸𝗲𝘁 𝗰𝗮𝘁𝗮𝗹𝘆𝘀𝘁𝘀 𝗮𝗿𝗲 𝗮𝗯𝗼𝘂𝘁 𝘁𝗼 𝗿𝗲𝗽𝗼𝗿𝘁.
Banks kick things off with JPMorgan leading the charge, while tech heavyweights like ASML, Taiwan Semiconductor, and Netflix could shape the next market trend.
Will strong earnings fuel the next breakout, or will volatility take over?
Tune in as we break down the charts, key levels, and what these reports could mean for traders.
Which earnings report are you watching most this week?
Follow us and join the conversation for live market analysis and trading insights.
Learn more: https://t.co/o7gpNIk9lw
#EarningsSeason #StockMarket
MetalCore just moved closer to its first real user cycle. That is where product stories either prove themselves or fade. NRED / NREDF
#ARGEGY#ARGxEGI#EGYARG#UserCycle#ProveIt
$NVDA $PLTR $PATH $MU $SOFI
Anyone with a laptop and internet can learn to trade properly, for free.
People blame money and tools for their results.
The whole toolkit costs almost nothing.
Here are the seven free tools that run my entire process ↓
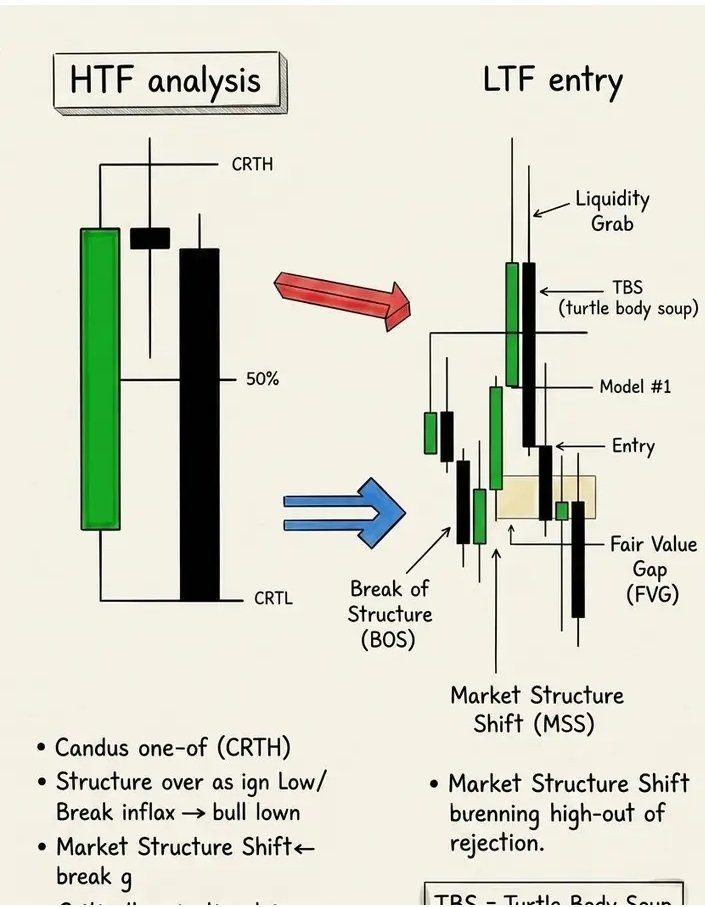
HTF Analysis – High Time Frame Context
Primary bias is determined on higher time frames (4H+) before drilling down to lower time frames for execution.
Key levels: CRTH (Cycle Relative Take High) and CRTL (Cycle Relative Take Low) act as major structural magnets.
Break of Structure (BOS) confirms trend continuation; a break of prior swing high/low validates directional bias.
Market Structure Shift (MSS) signals a potential reversal – occurs when price breaks a previous pivot high/low with strong momentum.
Liquidity Grab happens when price sweeps obvious stops above/below key levels, often trapping retail traders before reversing.
TBS (Turtle Body Soup) – a pattern where price engulfs the body of a prior large candle, indicating exhaustion and potential reversal.
LTF Entry – Low Time Frame Execution
Entry model #1 focuses on pullbacks into Fair Value Gaps (FVG) after a confirmed MSS on LTF.
Candus one-of (CRTH) – price reacting off CRTH with rejection candles (pin bars, engulfing) signals short entries.
Structure override: If price breaks a swing low and accelerates with high volume, treat as bullish breakout, not a fakeout.
MSS break high-out of rejection – when price breaks a recent high but immediately rejects, look for short entries with tight stops.
TRC (Turtle Body Scan) – scans for candles with unusually large real bodies relative to recent range, indicating strong imbalance and potential continuation.
Final confirmation: Wait for LTF BOS + FVG fill + liquidity sweep of recent swing point before pulling the trigger.
Before you enter any trade, write it down.
What's the 4H direction?
Where's the FVG?
Did the 15M confirm it?
Where's your entry?
Where's your stop loss?
Where's your profit?
If you can't write it, you shouldn't take it.
This one habit will filter out 80% of your bad trades.
The pinned tweet gives you the exact FVG model to journal around.
I tried a new loop today: posted a thesis on @xeetdotai and executed the trade on @lute. On Xeet, #InfoFi rewards the signal, not spam; on Lute, every setup leaves a visible track record and PnL you can’t hide. Old way: threads chasing likes and random screenshots. New way: accountable ideas, verifiable results, shared upside
There are 20 projects live on Xeet with leaderboards that surface real contributors, and $LUTE setups on Abstract felt instant. I earned Xeets for the write-up and let the trade speak for itself
Who else is running this signal -> execution stack #Trading #SocialFi?