We built an interactive site showing air pollution vs GDP changes in cities around the world.
Some highlights in this thread, and you can try it yourself.
Here are the biggest three cities in India (Yellow), China (red), and Germany (Orange).
1/
New Substack posts on India's progress with vaccination.
These posts are joint with Stuti Sachdeva & @profmohanan. It relies on vaccination data from @devdatalab (Thanks @thesamasher@paulnovosad Toby)
https://t.co/Nob2zkacaA
We (ie. @tobylunt) made a district-level COVID forecast for India: https://t.co/avTssKmBk3
A lot of places are past the peak of the second wave. In a lot of places, case counts are still rising.
We show Rt calculated from a model based on Bettencourt and Soman (2020). 🧵1/3
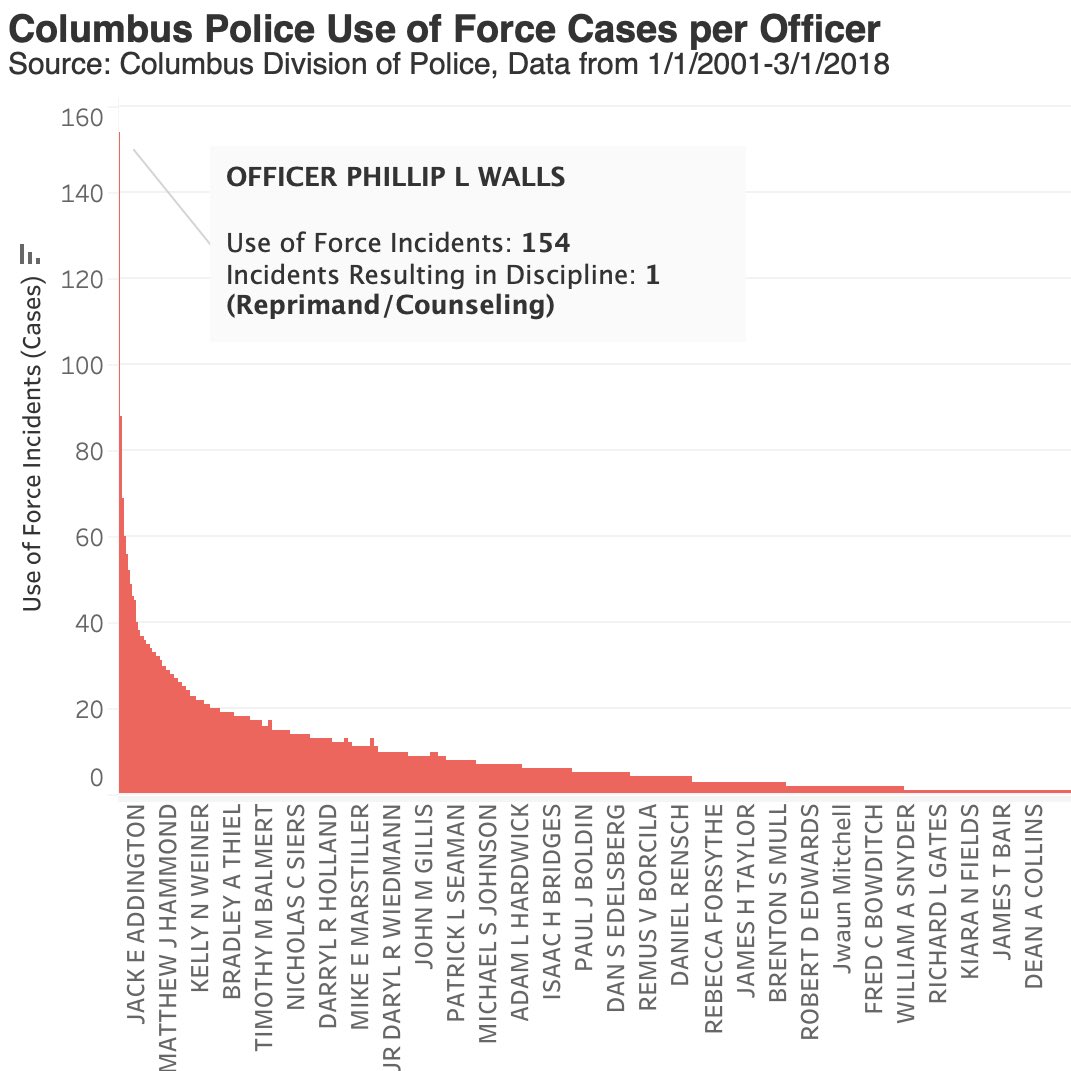
Here’s how often each Columbus police officer used force against people from 2001-2018. Some used force at substantially higher rates. But how often were they held accountable? A thread. (1/x)
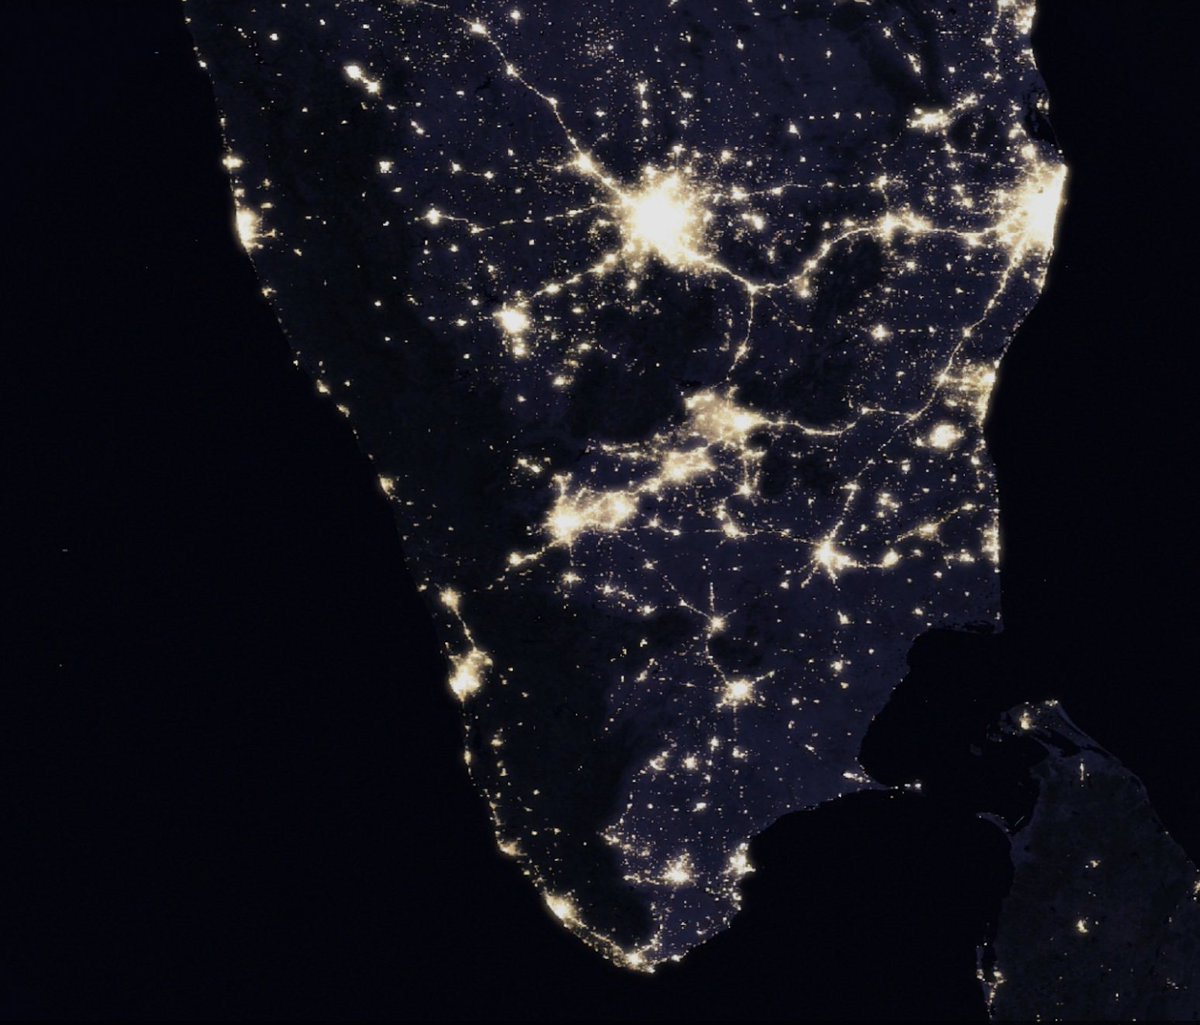
Are night lights (NL) a reliable proxy for local GDP?
An answer, in our paper “Development Research at High Geographic Resolution” aka the SHRUG paper (forthcoming at WBER). 🧵1/14
TL;DR: don’t trust existing GDP elasticities. With @paulnovosad @tobiaslunt @ryu_matsuura
🚨📊🚌Migration data now available on our COVID-19 India open data hub (https://t.co/JlU2Z1BJ99), contributed by/thanks to @clem_imbert@John_S_Firth. Blue map shows migrant destinations currently sending people home, green map shows migrant origins they’re returning to. (1/2)
@quintonconroy@ortambo_int@nicd_sa did you get an answer to this? i can't find any information about transit passengers from high-risk countries who are passing through tambo en route to elsewhere.