The Bitcoin % Dominance chart has now formed a 24-month rectangle with multiple upper and lower boundary contacts. For now this is the confining range. However, a decisive breakout of this range would have huge significance. My bias is that Bitcoin will bury all pretenders $BTC. Eventually there will be only one "King of the Hill," and it will be Bitcoin
'Gold's new monthly and quarterly all-time highs have gold bulls quite eager to see if this is the major breakout from the cup with handle pattern they have been waiting for. If so, the first upside price target (1.618 Fibonacci level) is at $3,000.' https://t.co/1BXFHk1cM2
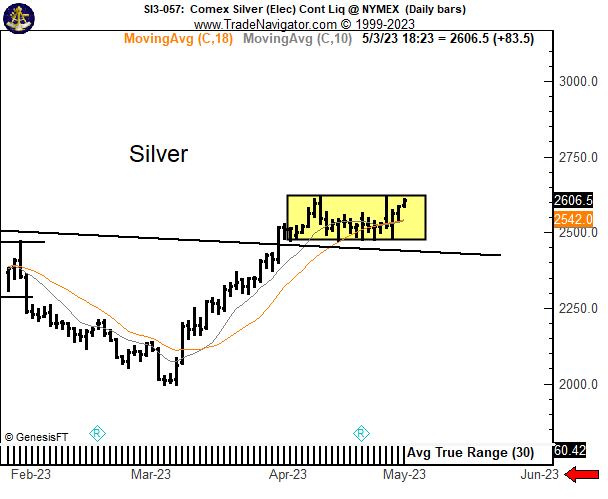
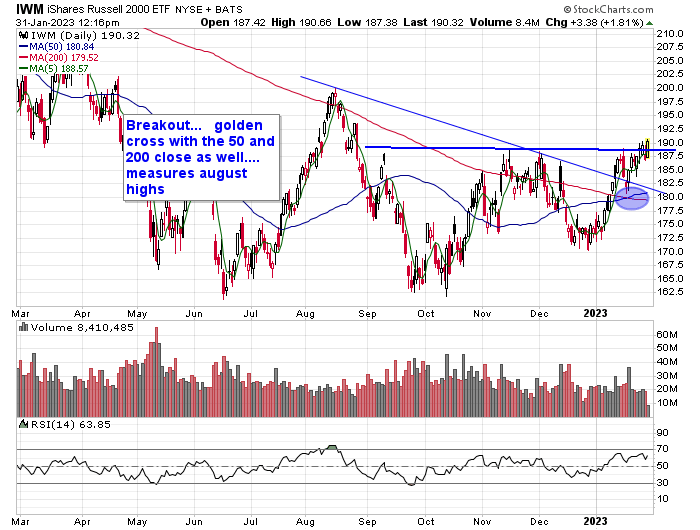
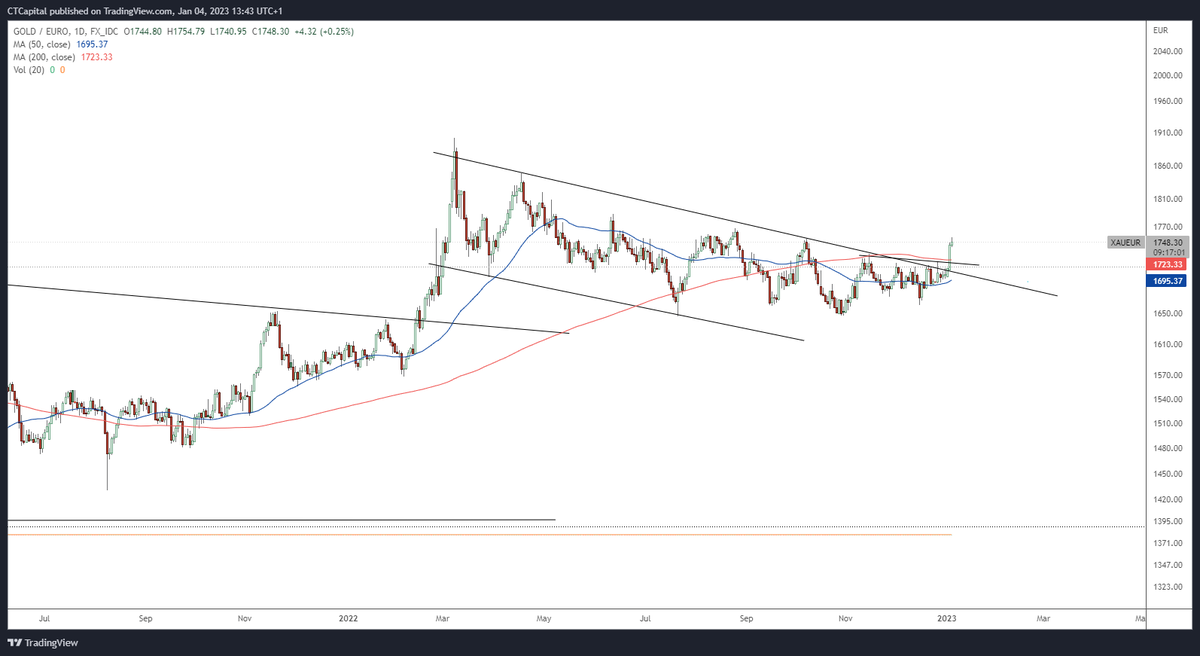
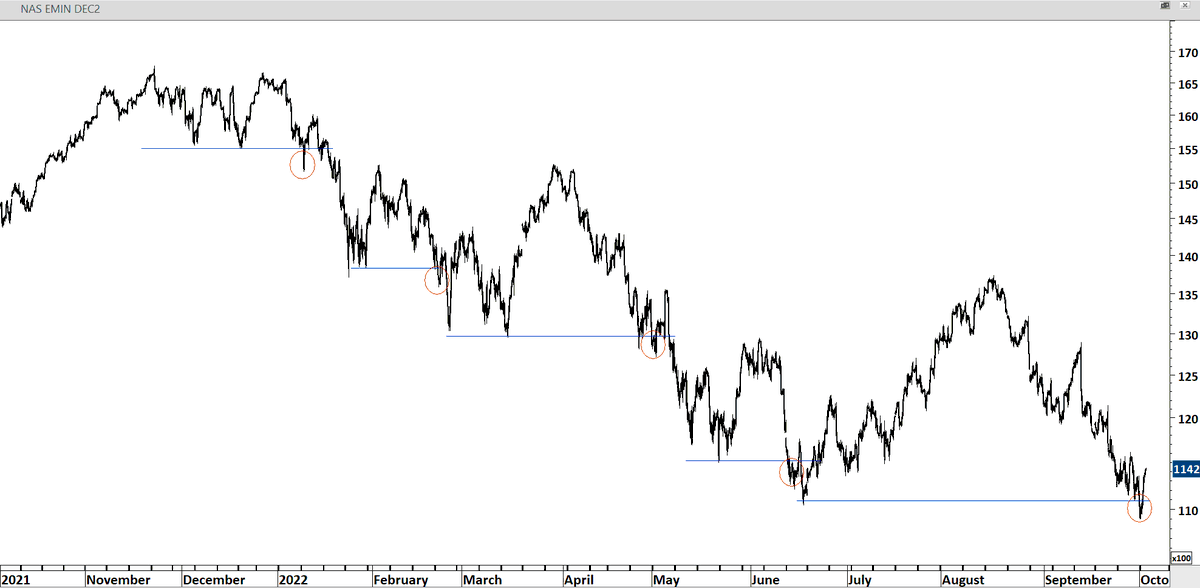
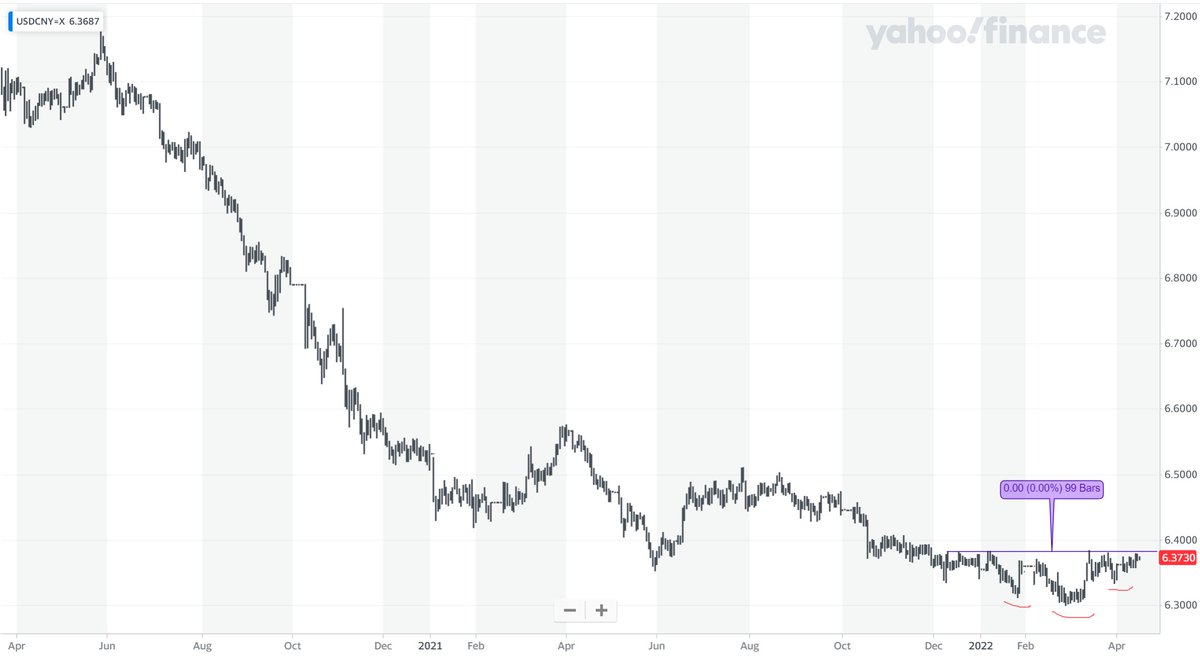
These are the chart patterns I focus on. From those only symmetrical triangle has diagonal boundary. All else acts on the breach of horizontal resistance/support.
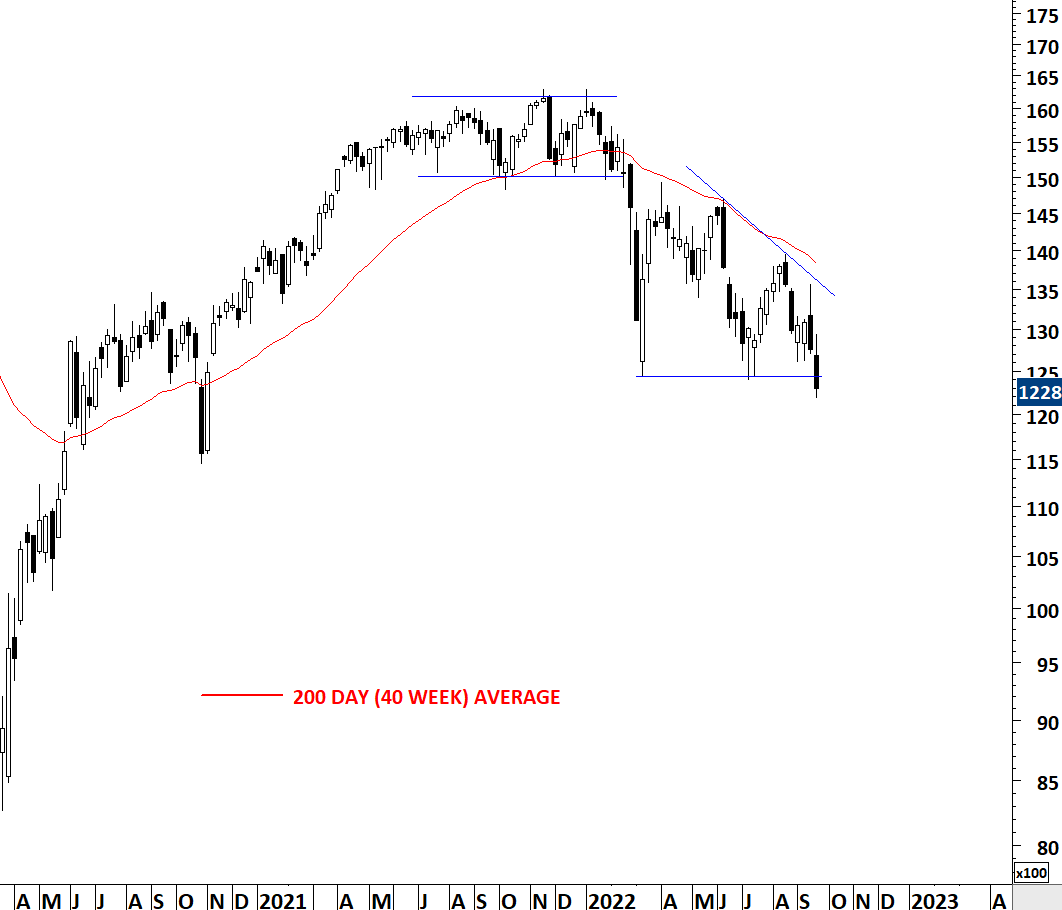
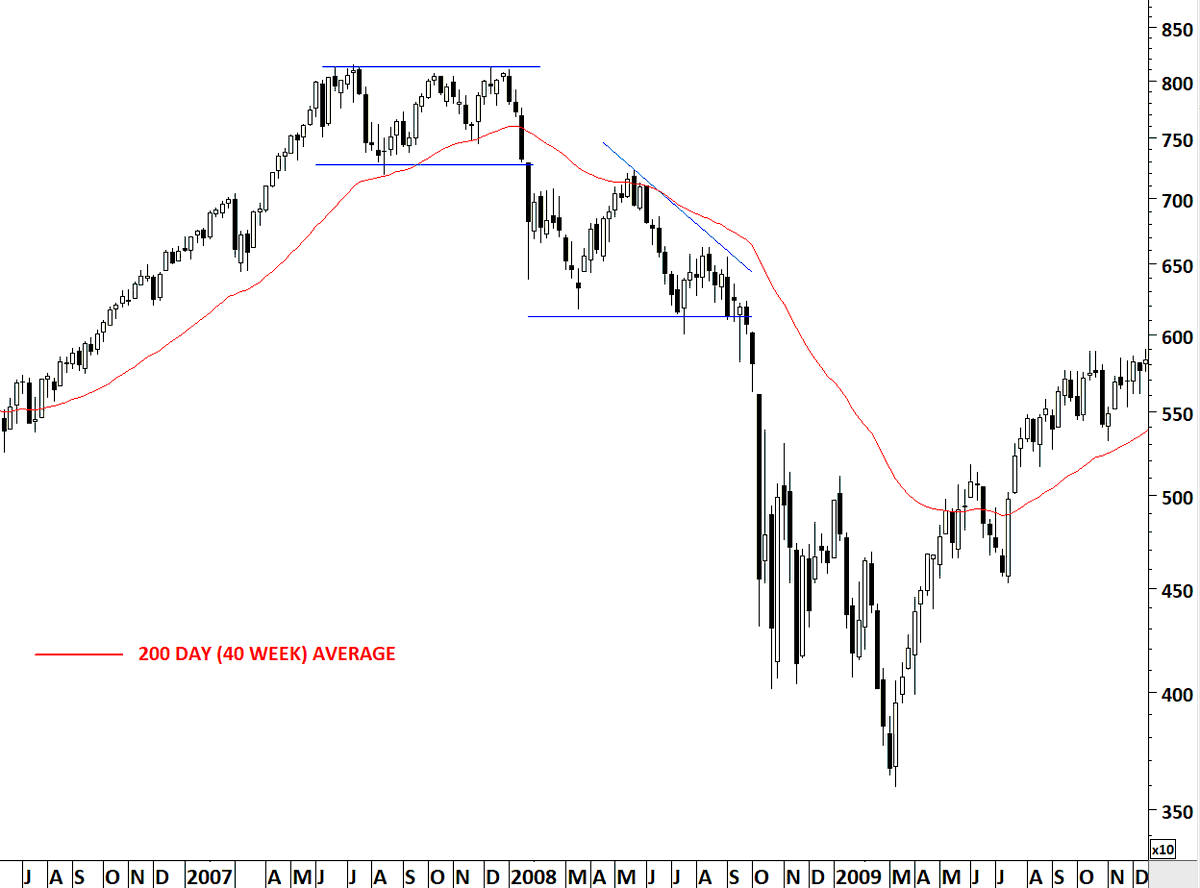
#GERMANY#DAX 2008 vs. now. Do you see similarities?
👉Top reversal
👉Price relative to 200 day average
👉Lower lows and formation of a descending triangle
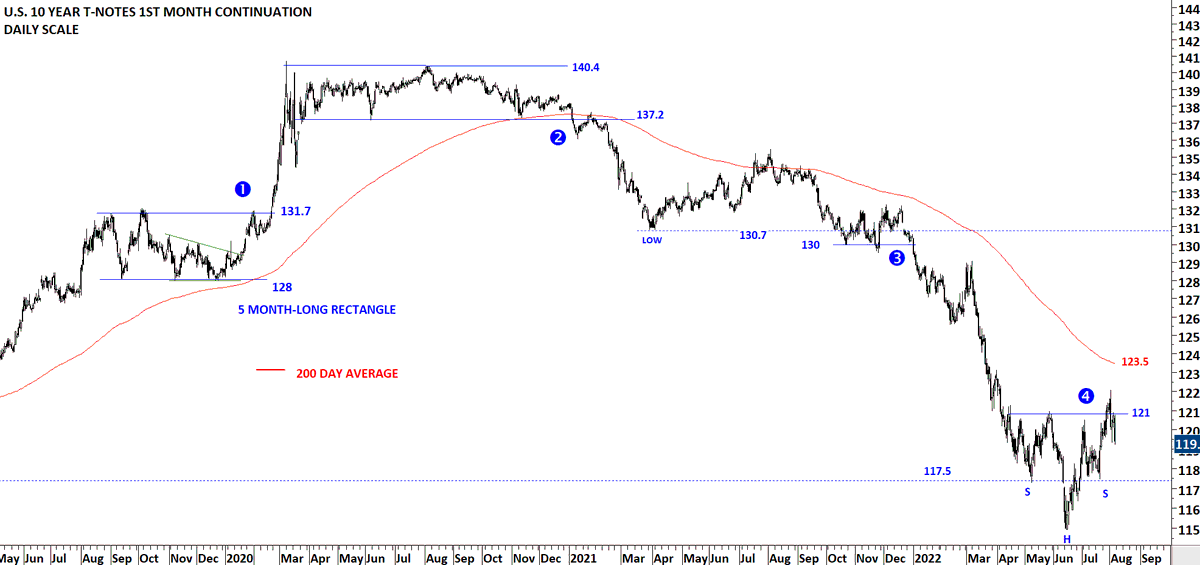
Trading bullish breakouts above the 200-day average and breakdowns below the 200-day average are high conviction.
You trade in the direction of the trend.
1,2 &3 are signals in the direction of the trend.
4 is not.
Do you see the difference? #TNX#BONDS
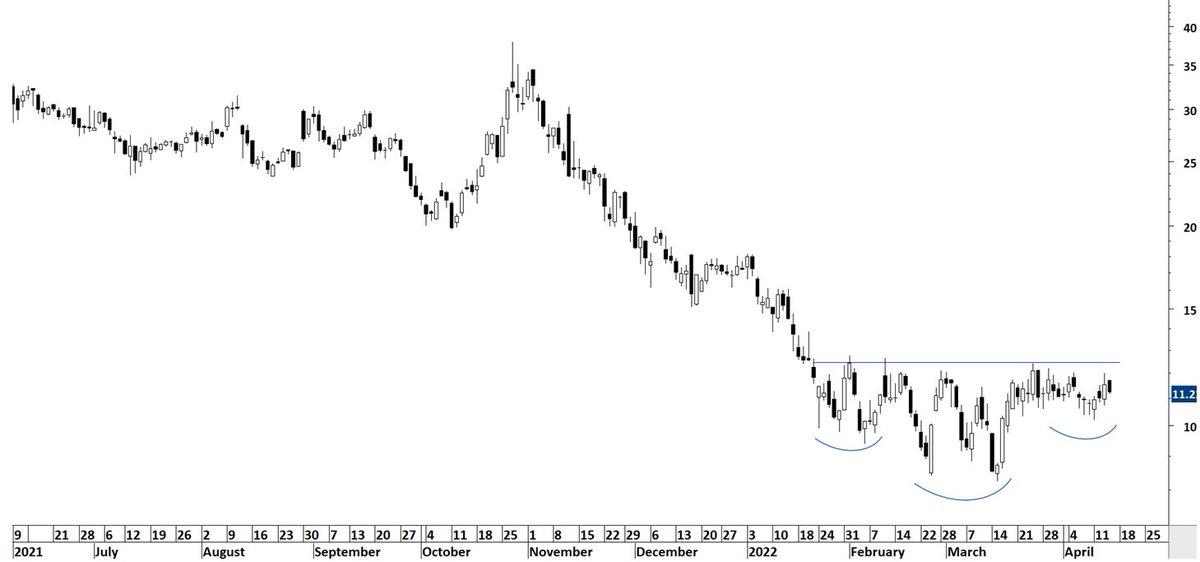
Next few weeks will be exciting in terms of these text-book H&S bottom reversal setups.
More with the upcoming report >> https://t.co/3PXD6BY0YF
@kkernttb I can't believe that you (all) in the US are sticking to a system that costs you all many times more than any other developed country, it simply doesn't add up. You can try to blame one instant but it's really the system you've chosen for yourselves.