Most trading tools show you the chart. Risk Lab shows you the statistics.
We built the lab around one idea: every decision you make as a trader should come with a number attached.
📈 CHARTING
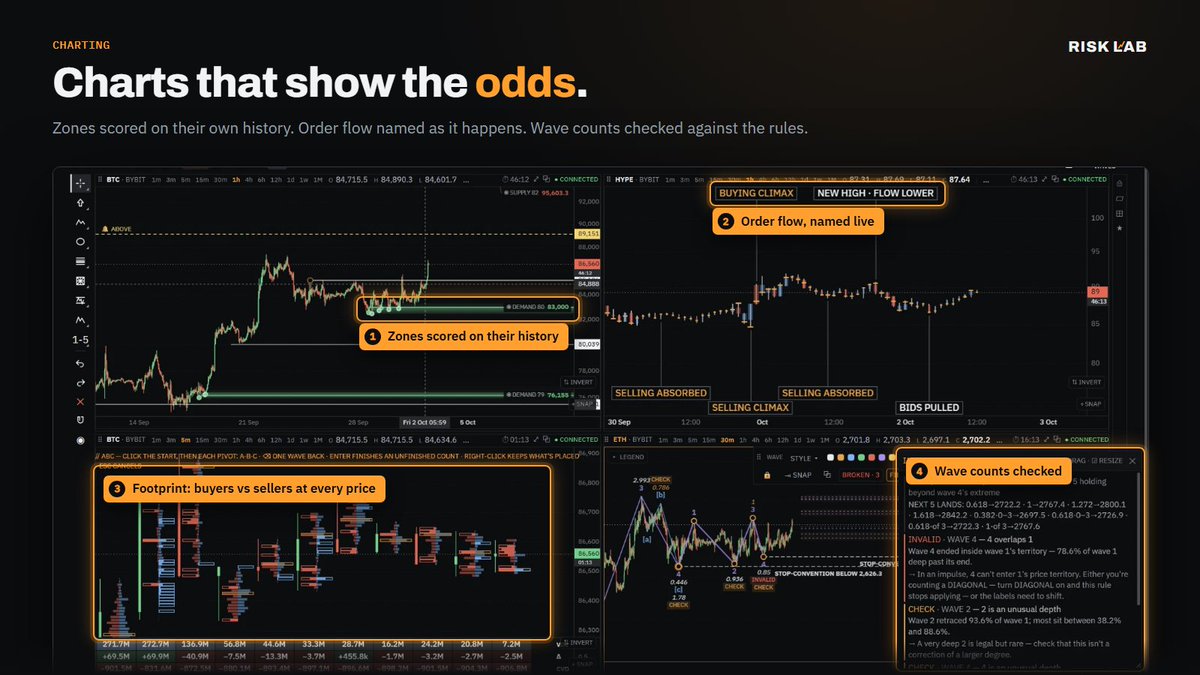
Every supply and demand zone is scored on its own history. Click one and the lab tells you how often zones like it held, how far price ran after each test, and how often price came back from this distance, with the confidence interval right next to the number.
Order flow is named as it happens: buying climax, selling absorbed, bids pulled. The footprint shows buyers vs sellers at every price inside every candle. Draw a wave count and the lab checks it against the rules, and tells you when wave 4 just broke your impulse.
👥 COMMUNITY
The Floor is where traders show their work. Plans are filed before the entry and scored after it. Every playbook carries its live record: win rate, average winner in R, how often it trades, and every win and loss on a dot strip you can't hide. Rank them by sample size or expectancy, not by who has the most followers. Watch members trade live, ask questions, copy a plan.
📓 JOURNAL (free)
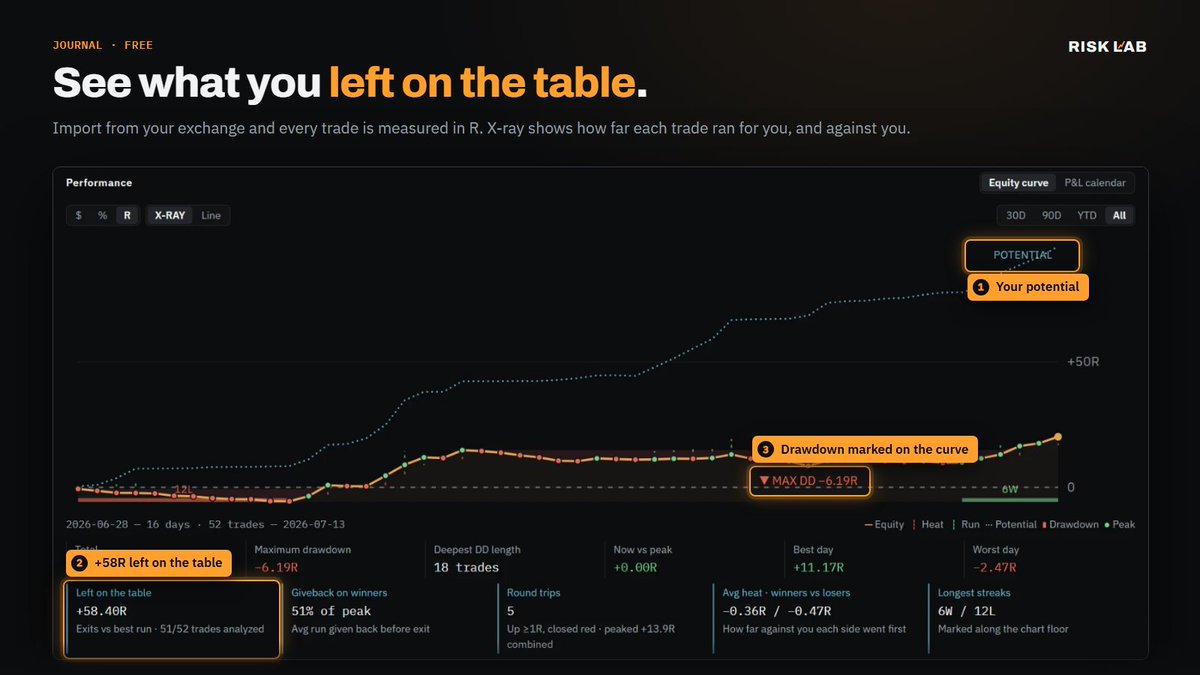
Import from your exchange and every trade is measured in R. The X-ray view shows how far each trade ran for you and against you, plots your potential next to what you actually took, and puts a number on it. Most traders don't have an entry problem. They have an exit problem, and now they can see it.
Charts with the odds. A community with receipts. A journal that tells the truth.
Start free → https://t.co/bhnoopTcsF
@barnc0re@tradingview Time to start using @luckychartape 's Risk lab,
journaling + TV + orderflow + automated strategy building / executing all in one,
You can try it out for free for a week using my ref link : https://t.co/0Qag3fNktU
Try it out yourself Barn, its really good!
This is life changing for me, and could be for you.
This is the most important thing I have ever done.
It is very likely this is a limited opportunity, take this seriously, and watch the video.
I believe this has the potential to be a turning point in your life.
Setting up my $BTC templates for trading on Risk Lab.
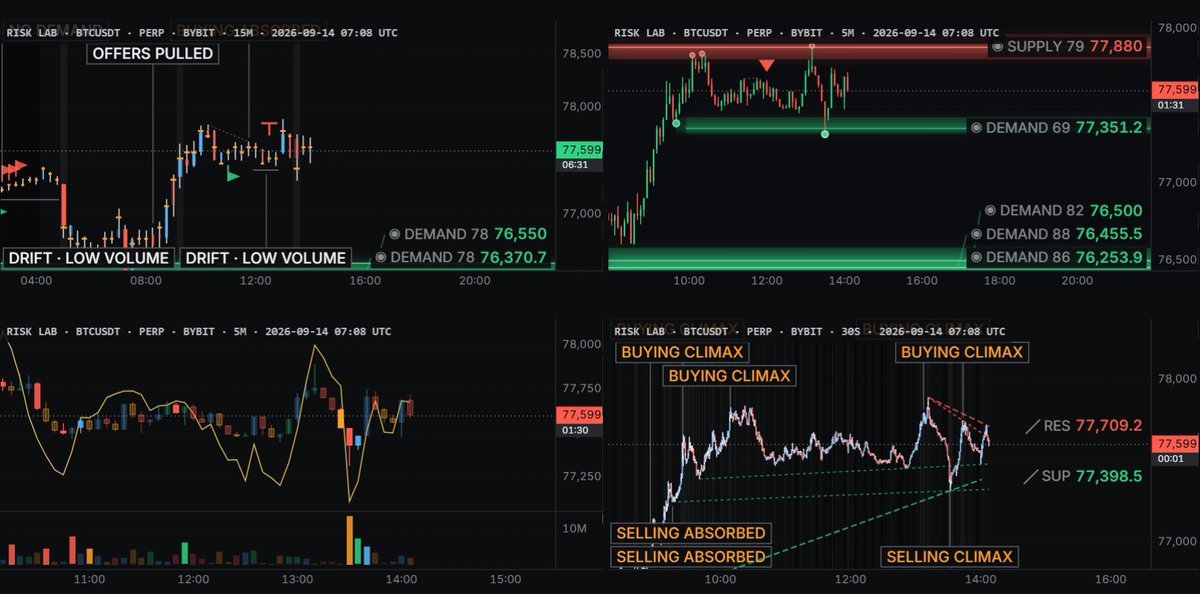
Everything you see on the chart is auto calculated, auto drawn, and auto labelled, trendlines, order flow, readouts, supply and demand.
A charting software that explains what is happening.
And this is just a fraction of what it can do.
How often do you avoid entering Setups that you preplanned or that fit your edge?
You think you won when you emotionally avoid a loss?
Thats basically the worst mindset you can build. It gets worse when you celebrate wins build on forced entries and gamble.
Why are you avoiding? Yes SL hit hurts more than a win makes you happy, but your emotions or the pain you don't take wont print you a single dollar.
Face the reality and accept that it hurts every single day and continue. Theres a reason why 2 people fight while thousands are watching.
Stop watching and start fighting. Taking pain is a skill that you can and have to learn.
RISK LAB — what it is today, and why nothing else out there comes close.
Long post. Worth the read if you're serious about trading.
■ THE CHARTS
We built our own charting engine. From scratch. Not a TradingView clone, not a wrapper — an engine designed around one idea: the chart should show you what's actually happening, not just price.
→ Order flow on every chart: footprints, delta, CVD, open interest waves, extreme-candle detection. Real tape, collected around the clock across multiple venues.
→ Confluence entry tools that stack your reads into one picture.
→ Alerts that fire the instant price touches your line. Bell + sound. No refresh, no delay. Alerts can be triggered by conditional confluences, including order flow. Not just price.
→ And it all works on your phone. Smoother then any mobile charting tool I have ever used. A phone-first chart.
■ ELLIOTT WAVE THAT CHECKS YOUR WORK
Every other platform gives you a wave tool that draws pretty labels and lets you believe whatever you want.
Ours reads your ENTIRE count in context. Mark your waves and the lab validates the structure against the actual rules — and when your count breaks one, it doesn't just flag it. It marks exactly where the break is, explains WHY it's a break, and suggests how to fix the count.
Wave 2 retracing past the start of 1? Wave 3 the shortest? Wave 4 overlapping 1? You'll know — before the market teaches you the expensive way. It's the difference between a labeling tool and a second set of eyes on your structure.
■ BACKTESTING WHERE IT BELONGS: ON THE CHART
Replay the market bar by bar. Mark your entries directly on the chart. Test a setup against real history, save the test, and it feeds straight into your stats.
Your backtests, your plans, and your live trades all live on the same desk — so the question "does this setup actually work?" gets answered with data.
■ THE JOURNAL — THE CORE OF THE LAB
This is what the whole platform is built around: statistical trade journaling.
→ Import from 20+ platforms and prop firms: Hyperliquid, Bybit, MEXC, Binance, Bitget, FTMO/MetaTrader, Tradovate, NinjaTrader, GMX, Breakout, TradingView replay exports, and more.
→ Your platform not supported? Send us the file. We build the importer. Members ask, we ship.
→ Every trade gets x-rayed: max heat taken (MAE), max favorable move (MFE), what price did AFTER you closed. You find out — with numbers — whether you're cutting winners and holding losers.
■ THE MATH NOBODY ELSE DOES
→ Playbooks with real statistics: SQN, confidence intervals, edge probability, Kelly sizing. Not "win rate" dashboards — actual significance testing on your setups.
→ A Bias Lab that profiles how you sabotage yourself.
→ A stop/exit optimizer that replays your real trades and shows what different stops, targets, and partials would have done.
→ Monte Carlo simulation on your actual distribution — so you know your real drawdown risk before it happens.
→ A weekly report that reads your week back to you, deterministically, from your own data.
→ Rule-cost analysis: what breaking your own checklist actually costs you in R.
■ THE FLOOR
A live trading floor, not a dead chatroom. Live sessions you can broadcast and watch, a multi-chart watch deck, pre-flight trade planning shared with the room, paper-along journals, earned badges and name styles that mean something. Plus a Discord that's wired directly into the platform.
■ WHY IT'S BETTER THAN ANYTHING OUT THERE
Everything talks to everything.
Your chart knows your trades. Your journal knows your plans. Your backtests feed your stats. Your stats feed your sizing. Every other product gives you ONE piece — a charting site, or a journal, or a backtester — and none of them share data.
Risk Lab is one loop: import → categorize → measure → analyze → optimize → simulate. Built and shipped daily, shaped directly by the members using it.
And you can start free: the full journal — every importer, the trade x-ray, the works — plus the full Monte Carlo simulator. No card.
https://t.co/PSvcIm2sBo
The lab is open. 🧪🦍