The best time to build your watchlist is DURING the correction...
BUT
Building the list doesn't mean buying it yet
A stock holding up better than the market isn't a buy signal on its own in this tape
Here's how I'm building mine right now:
Find the groups holding up best while the indexes correct
Compare each stock's drawdown to the index.
If $QQQ is down 10% and a stock is down 3%, that an anomaly you can build on
Check the 50 EMA....
Leaders usually hold it or reclaim it fast while everything else slices through
Look for tightening
Ranges contracting
Volume drying up
Base forming instead of lower lows
Then I narrow it down to 4-5 names and set alerts at the levels that would prove them right
When the market finally turns, these are usually the first ones to break out
I don't want to be finding them then
I want them already on my screen
Also a clear distinction is that you're looking for technology stocks that can lead the market higher in the coming cycle.
Not defensive stocks that are just going higher because money is flowing there out of fear
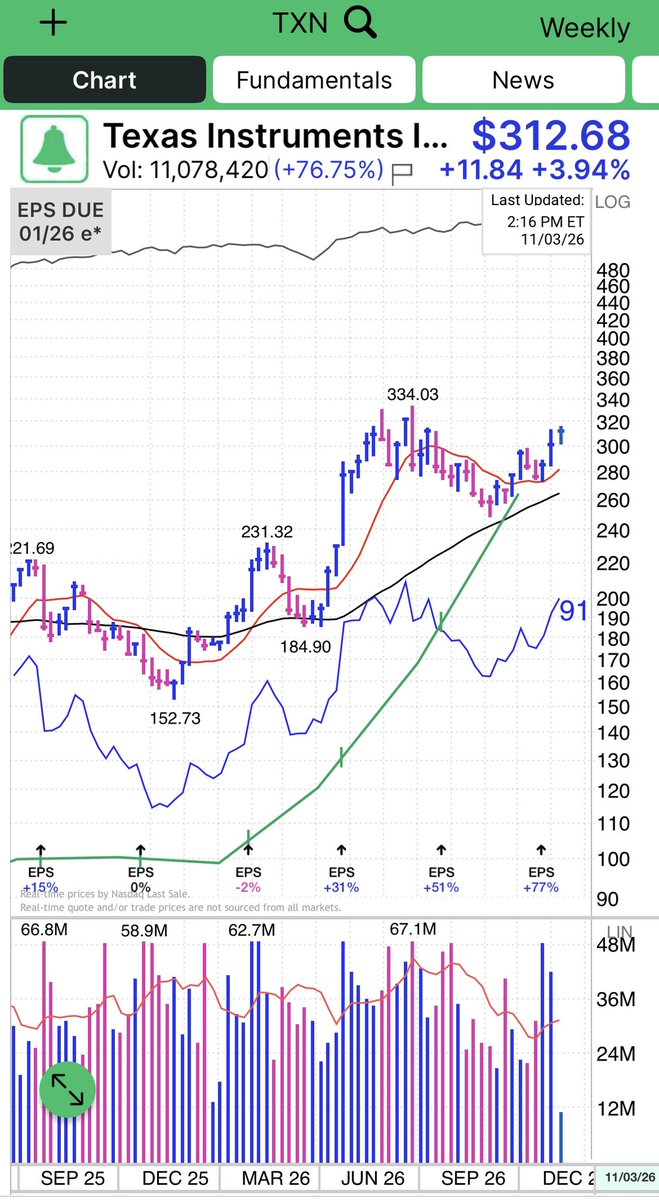
Some examples of names I'm tracking $TXN $ADI $NXPI $SPOT $TSLA
Market Wizard Linda Raschke's 12 Technical Trading Rules
1. Buy the first pullback after a new high. Sell the first rally after a new low.
2. Afternoon strength or weakness should have follow‑through the next day.
3. The best trading reversals occur in the morning, not the afternoon.
4. The larger the market gaps, the greater the odds of continuation and a trend.
5. The way the market trades around the previous day’s high or low is a good indicator of the market’s technical strength or weakness.
6. The previous day’s high and low are two very important “pivot” points, for this was the definitive point where buyers or sellers came in the day before. Look for the market to either test and reverse off these points, or push through and show signs of continuation.
7. The last hour often tells the truth about how strong a trend truly is. “Smart money” shows their hand in the last hour, continuing to mark positions in their favor. As long as a market is having consecutive strong closes, look for the up‑trend to continue. The up‑trend is most likely to end when there is a morning rally first, followed by a weak close.
8. High volume on the close implies continuity the next morning in the direction of the last half‑hour. In a strongly trending market, look for resumption of the trend in the last hour.
9. The first hour’s range establishes the framework for the rest of the trading day.
10. A greater percentage of the day’s range occurs in the first hour than was the case in the past, and thus it has become increasingly important to trade aggressively if there are early signs of a strong trend for the day.
11. There are four basic principles of price behavior which have held up over time. Confidence that a type of price action is a true principle is what allows a trader to develop a systematic approach.
The following four principles can be modeled and quantified and hold true for all time frames, all markets. The majority of patterns or systems that have a demonstrable edge are based on one of these four enduring principles of price behavior. Charles Dow was one of the first to touch on them in his writings.
Principle One: A Trend Has a Higher Probability of Continuation than Reversal
Principle Two: Momentum Precedes Price
Principle Three: Trends End in a Climax
Principle Four: The Market Alternates between Range Expansion and Range Contraction
In the world of money, which is a world shaped by human behavior, nobody has the foggiest notion of what will happen in the future. Mark that word – Nobody! Thus the successful trader does not base moves on what supposedly will happen but reacts instead to what does happen.
In a market that's down trending there are really only two ways to trade in my opinion..
Longing relative strength only works until the whole market starts deteriorating and everything pulls in
In a downtrend what I would focus on is:
1. Overextension reversals on multi-day downside moves into key levels
2. Shorting multi-day/multi-week rallies into key moving averages
When the market is in limbo between these two zones
- Extended to the downside but not extended enough to be an overextension reversal
-Starting to push into the EMAs but only on day 1 or 2 of the bounce
There really isn't a ton to do between these two zones
I'm always looking for the areas where there's the highest probability.
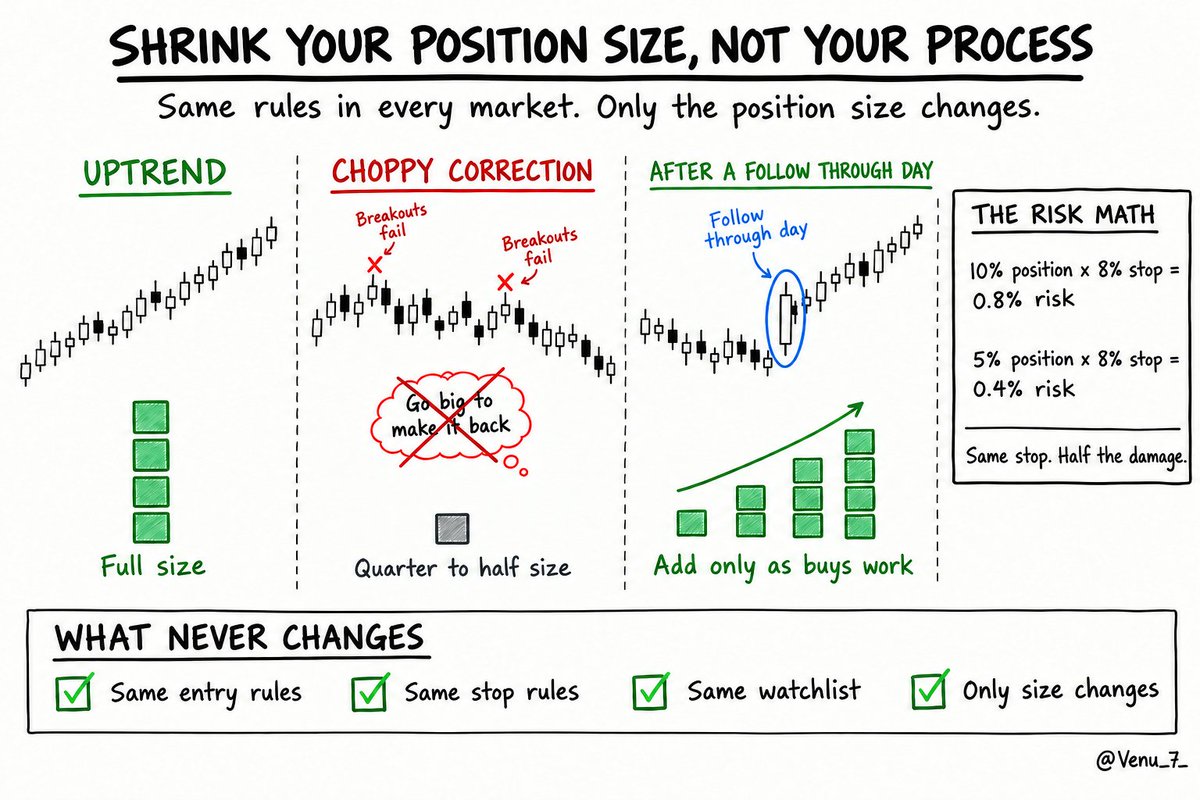
Shrink Your Position Size, Not Your Process.
One of the biggest mistakes during market corrections is abandoning a proven framework or increasing position sizes to recover losses.
The approach is simple: adjust your exposure to market conditions, not your discipline.
1. Confirmed Uptrend: Normal position sizing when breakouts are working and market leadership is expanding.
2. Choppy Correction: Reduce positions to a quarter or half of normal size. Failed breakouts and increased volatility demand smaller exposure.
3. After a Follow-Through Day: Start small and gradually increase exposure only when your purchases begin working.
Here's the risk math:
- 10% position × 8% loss = 0.8% portfolio impact.
- 5% position × 8% loss = 0.4% portfolio impact.
Same percentage loss. Half the portfolio damage.
Reducing position size doesn't mean lowering your stock selection standards. Focus on relative strength, healthy price structures, and improving market breadth. If opportunities aren't there, staying in cash is also a valid decision.
Your entry rules, exit criteria, and stock selection process should remain consistent regardless of market conditions.
A follow-through day doesn't guarantee the correction is over. Let price action and market leadership confirm the improvement.
The market will offer new opportunities. Make sure you're in a position to take advantage of them.
Huge paradox of a trader's mindset:
Many traders feel they need to trade to feel like traders.
Sounds strange, right?
But think about it. If you identify yourself as a trader, what happens when you spend days or even weeks without taking a single trade?
You start feeling unproductive. You question whether you're doing enough. You feel the urge to get involved.
Why?
Because taking trades confirms your identity as a trader. It gives you a sense of purpose, accomplishment, and sometimes even self-worth.
And that's where the real problem begins.
You start looking for opportunities that aren't there. You lower your standards. You take mediocre setups. Not necessarily because you believe they're great trades, but because doing nothing feels uncomfortable.
I believe this is one of the hidden psychological drivers of overtrading.
The solution isn't simply to become more patient. It's to change how you define yourself as a trader.
A trader isn't someone who constantly buys and sells stocks.
A trader is someone who follows a strategy, manages risk, and only commits capital when the odds are in their favor.
Sometimes that means taking several trades. Sometimes it means sitting in cash for weeks.
Both are part of the job.
Your identity as a trader should come from the quality of your decisions, not the number of trades you take.
This is the mindset shift you need to become rich with stocks.
Instead of being sad that your portfolio is red, be very HAPPY you get to buy cheaper once you have money from your paycheck.
Never worry about red days. It is actually an amazing blessing.
Keep investing and buying, rain or shine on schedule every two weeks.
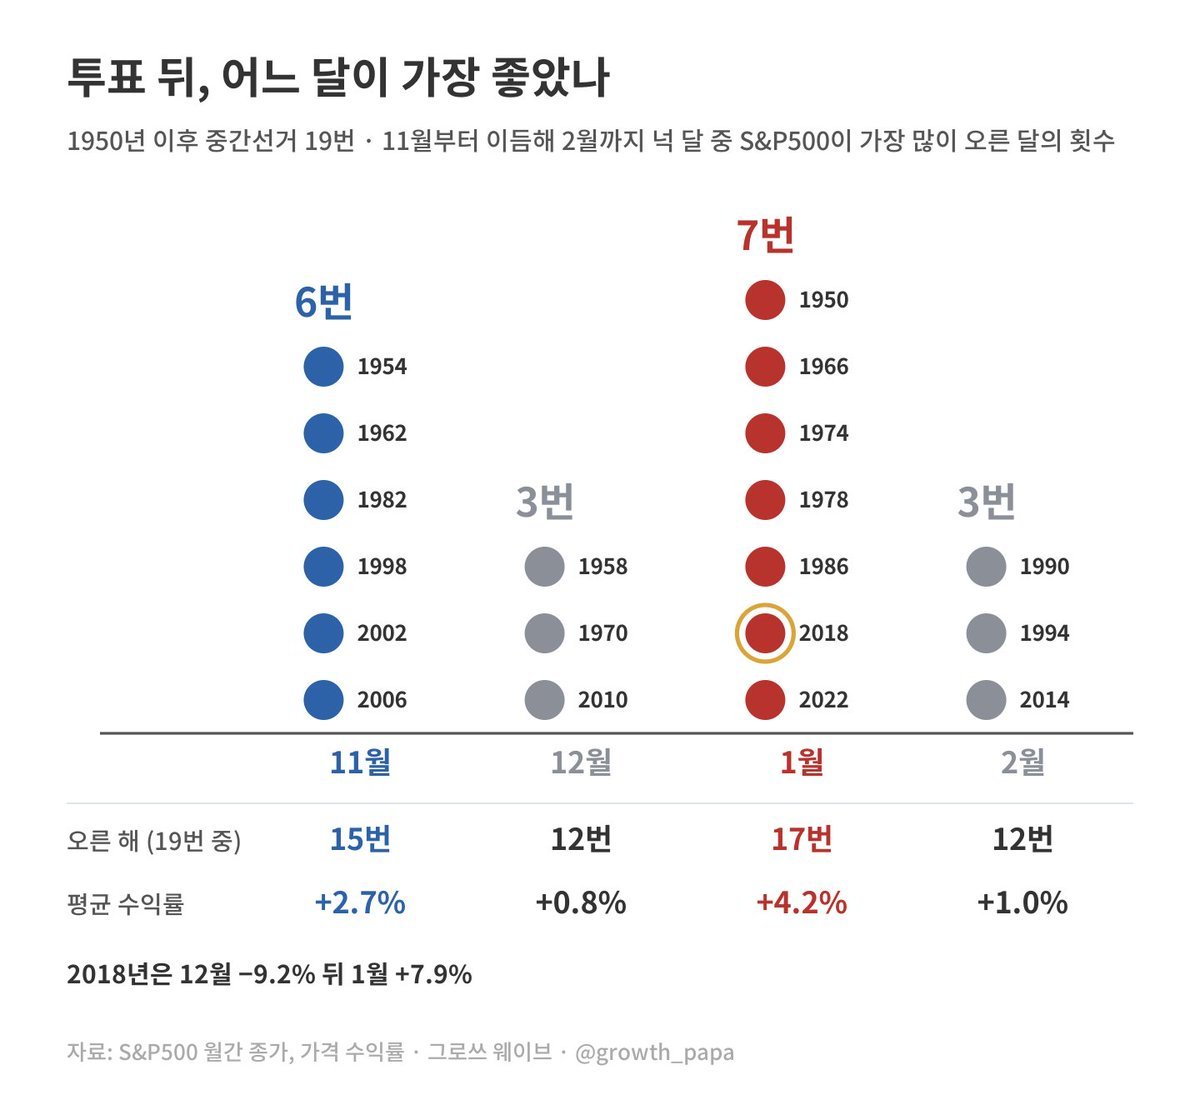
중간선거가 있던 해의 9~10월 바닥은 흔한 일이었습니다. 다만 제가 지금과 가장 비슷하게 본 2018년에는 12월까지 조정이 이어졌습니다.
조정 뒤에는 대체로 1~3개월 안에 가파른 반등이 있었습니다.
나스닥 온도계가 20 밑으로 떨어진 뒤 50을 회복하는 데도 보통 3개월 안쪽이 걸렸습니다(2018년에는 6개월 가까이 걸렸음)
이를 감안해 앞으로 3개월의 전략이 눈에 그려지면 좋겠습니다.
I have a hard rule where I don't buy stocks below their 50SMA.
Why? They likely haven't proven themselves.
I may not be first, but this stupidly simple rule has saved me so much frustration and money.
Infinitely more than I've missed diving in first.
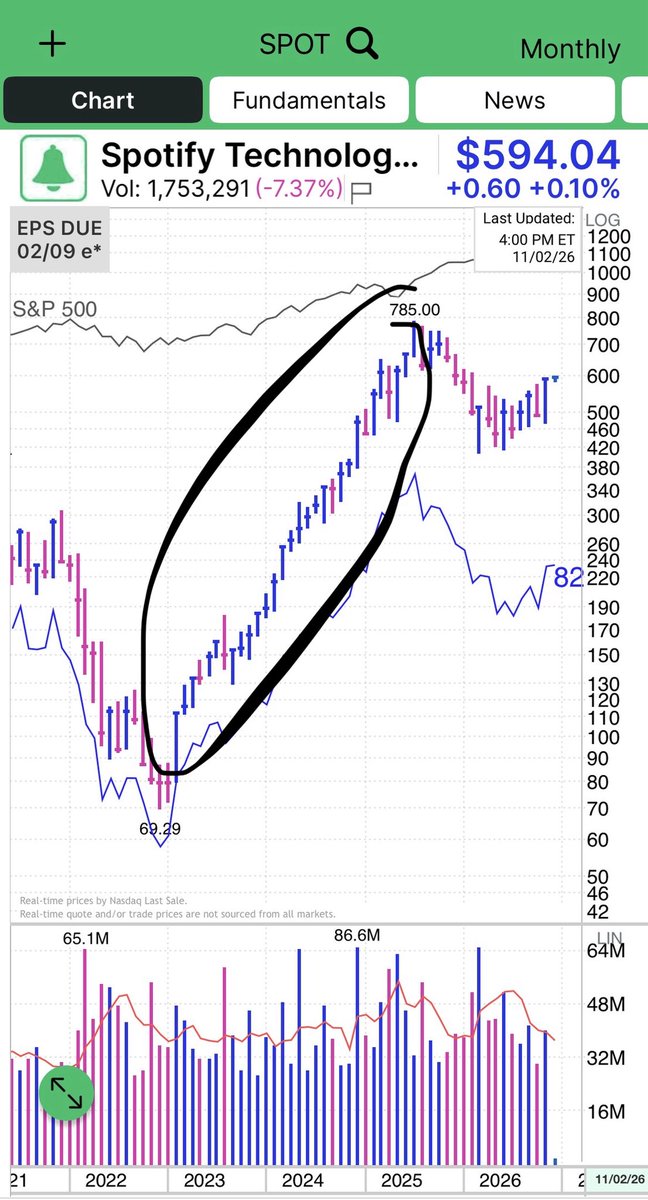
When a name has a massive prior run, $SPOT, 800+%, and then puts in a big long base and sits out a tech run, and the starts to show RS in a correction it goes on the watch list. $TSLA did this in 2019 and again now like SPOT. These are type of names that can be potential new leadership in the next uptrend.
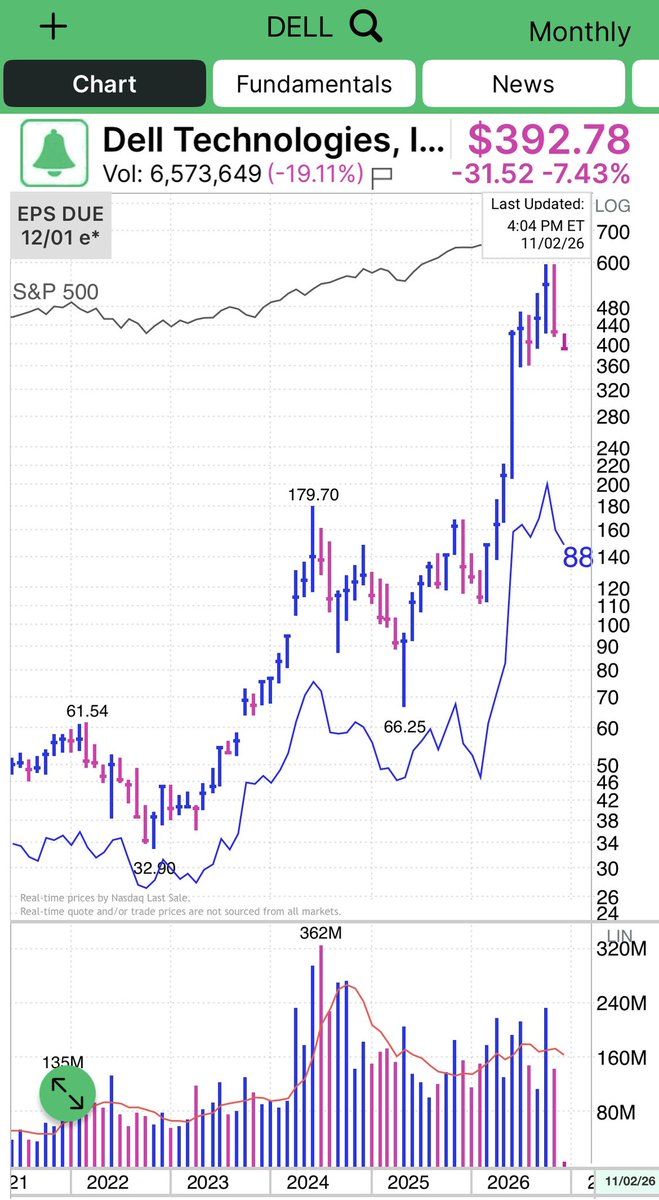
$DELL was an example in this recent uptrend. It based in the 2024 tech run and lead the recent April rally this year, $ARM as well.
I traded TSLA for a 270% gain in 2020 and DELL for a 160+% gain this year w several trims and buys along the away, & traded $ARM the same as DELL this yr too for a 130+% gain w trims and adds along the way.
On the WL for whenever we get a FTD someday- $SPOT $TSLA
People get so wrapped around the axle with indicators, but indicators are just tools to assist you. If you strip away all the indicators and just have price and volume, you should still be able to trade your method. I can trade the way I trade with no indicators at all, or I can use a multitude of different indicators and arrive at very similar conclusions.
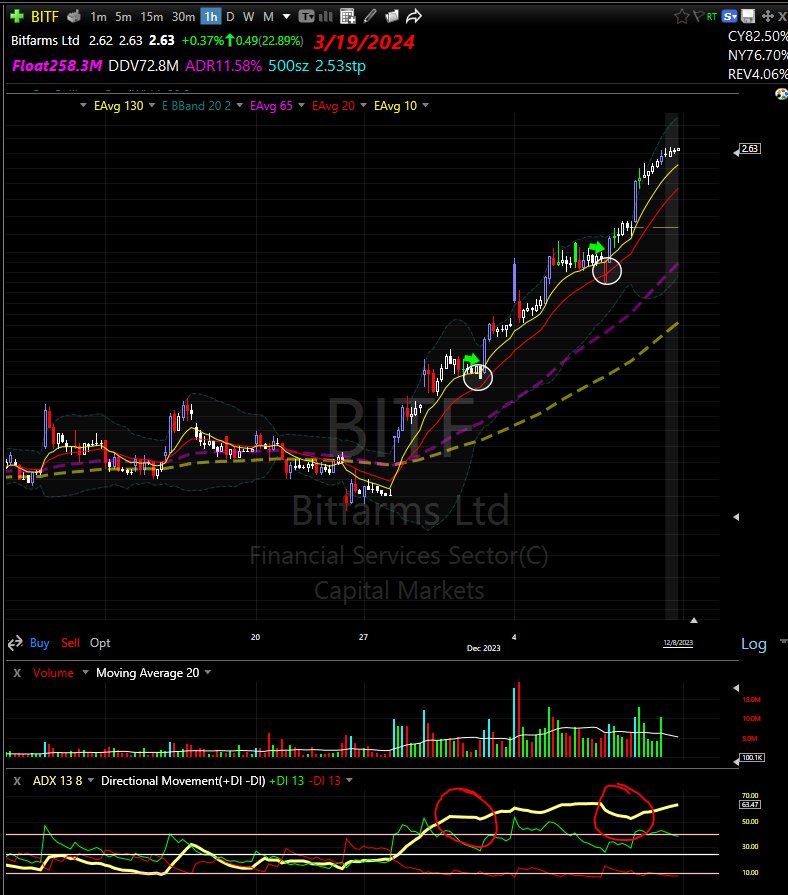
I tend to use bollingerbands, moving averages, ADX/DMI, and volume buzz. Not because I need these things to trade, but they are certainly useful. Rather than eyeballing 2,000 charts, I can intelligently use these indicators to pull out the specific kinds of situations I'm looking to exploit. Could I manually thumb through 2,000 charts? Sure, I could. In fact, I did that for many many years. I would review several hundred charts every single day and probably 1,000+ on the weekend.
Do I need to do that every night now? No. If I can smartly cut 1,000 charts down to 100, why would I not do that? At this point in my trading career, I know exactly what I'm looking for. At the end of the day, it's not about the indicator (which is just a derivative of price and volume). It's about understanding why you're using the indicators and what they are assisting you with. I use indicators to gain efficiencies in my trading process - not as if they are some magical instrument that tells me how to trade.
Dave Landry's concepts of slope and daylight are super easy to understand and see on a chart. When I'm looking for setups on the hourly chart, I want a strong upslope of the 10/20 EMA and separation between them. This is no different than what the ADX indicator is doing - a strong green over red DI, with an upsloping ADX is indicating the same phenomenon, just using different tools.
Whether using daylight and slope or ADX, these sorts of "first leg up" situations tend to be my starting point. Why? Because this is the strongest evidence of consistent demand. Remember, we want to trade stocks that are showing demand, because this continued demand creates follow-through from our entry and this is what pays us. Once in a stock, we're literally relying on the demand of others. It doesn't matter if I demand a stock or think it's good. I get paid by other people wanting that same stock and continuing to push it higher and higher.
This should seems like a "no shit" concept, but people don't actually understand this to be the case by how they trade. They will buy a do nothing stock showing zero demand, because of the story or "the potential" or some other random reason. And then they sit there with dead money. This is a huge opportunity cost, especially in strong markets when there are stocks actually showing demand.
Find stocks that have shown slope and separation in their 10/20 EMA, ideally with strong volume signatures as well. These stocks should be on your radar while you wait for an entry, whether you use some sort of pullback technique like Landry, or some sort of higher low flag/wedge/triangle/VCP like Qullamaggie or Minervini.
With the market in a correction, now's a good time to review the basics of pullback and compression patterns.
Some good resources:
Layman's Guide to Stock Trading by Dave Landry
5 Secrets to Highly Profitable Swing Trading by Ivanhoff
https://t.co/XCo39PHAQc
https://t.co/8ANyimu6Tp
https://t.co/mZW3DDX0fn
https://t.co/HMAW6JY02m
We've got another big big week of earnings, midterm elections, and some seriously broken weekly charts.
Just thinking out loud here as we head into another monster week of catalysts, but there's a lot I want to unpack.
Earnings this week to watch:
Monday: $PLTR + $AAPL.
Tuesday: $ANET, $ALAB, $SHOP & $AMD.
Wednesday: $QCOM, $FSLY, $DDOG, $APP & $ARM.
Thursday: $NET, $TEAM, $U, $LITE & $AAOI.
Friday: $MRNA.
$SPY + $QQQ both made lower lows and finished the week red, while $IWM showed some relative strength and managed to close green. Interesting divergence, but not nearly enough for me to start pounding the table.
I'll be the first to tell y'all, some of these weekly charts are an absolute disaster right now. Former leaders have lost major pivots, broken their bases + are showing characteristics of Stage 3 → Stage 4 transitions. Whether we like it or not, that's what price is telling us.
Could we get a sharp oversold bounce early next week? fosho. Heck, I wouldn't be surprised to see a few names rip right back into their declining 9/21EMAs before sellers show up again. What I'm more interested in is HOW those bounces behave...do buyers actually defend the move, or do we get another dead-cat bounce that fades into the weekly close?
Here's something I've been thinking about quite a bit lately...what if the real pain trade isn't another massive leg lower, but 2-3 months of absolutely NOTHING?
A few weeks of selling, followed by months of sideways chop while broken leaders digest their prior moves, moving averages flatten + new bases slowly develop. I genuinely don't think enough traders are prepared for that possibility. I see that everyone's so focused on calling the next crash or the next rip to ATHs that they're forgetting the market can punish you by going nowhere while you slowly bleed your account dry forcing trades that aren't there.
and with midterm elections Tuesday night, another packed earnings calendar + volatility, I'm keeping my expectations extremely short-term. taking it 1 day at a time...I'm talking 1-3 days max, focusing on the next logical move rather than trying to predict where the market will be in January.
Now, if leadership starts waking up, breadth improves, indexes reclaim key MAs + my own positions begin working, I'll gladly reconsider my outlook. I'm not married to a bias. I just haven't seen enough evidence to justify getting aggressive, and I personally don't expect all this technical damage to repair itself in a couple trading sessions.
Maybe we spend the next few months rebuilding before a healthier push toward ATHs in 2027. Maybe buyers surprise us much sooner. nobody freakin' knows!!
but for right now, I'm staying cash heavy, selective and protective of what I've built thus far. I'll keep tracking leading/lagging names, continuously studying which groups are holding up, and will wait for the market to show me where the next asymmetric opportunities are if things start to spurt back up.
patience, patience, patience.
Just my 2 cents heading into the week!!
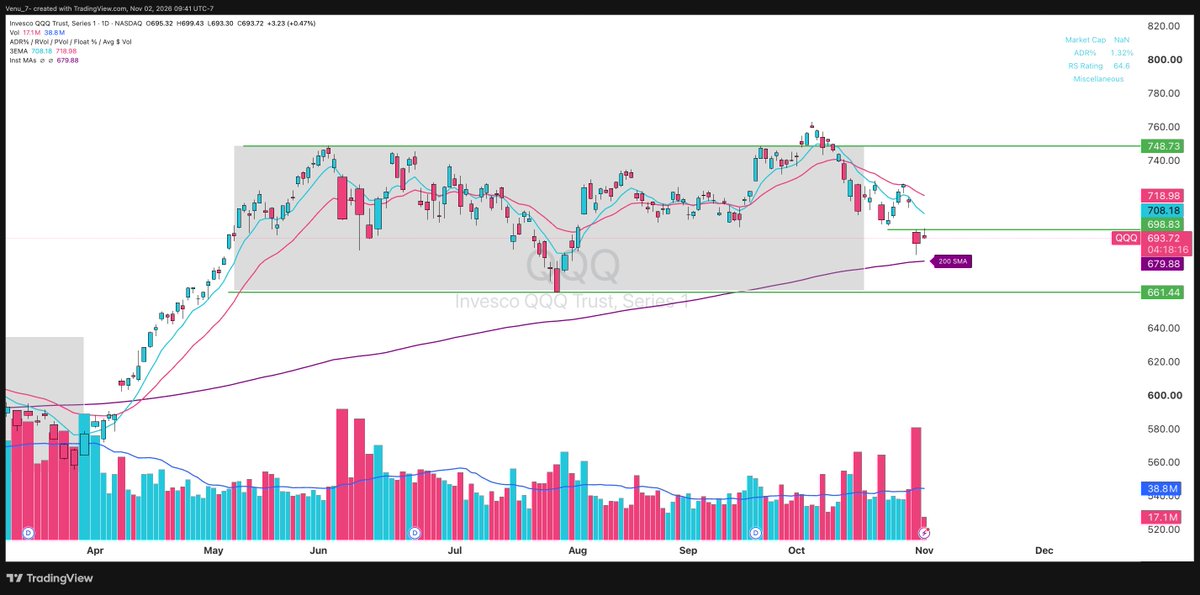
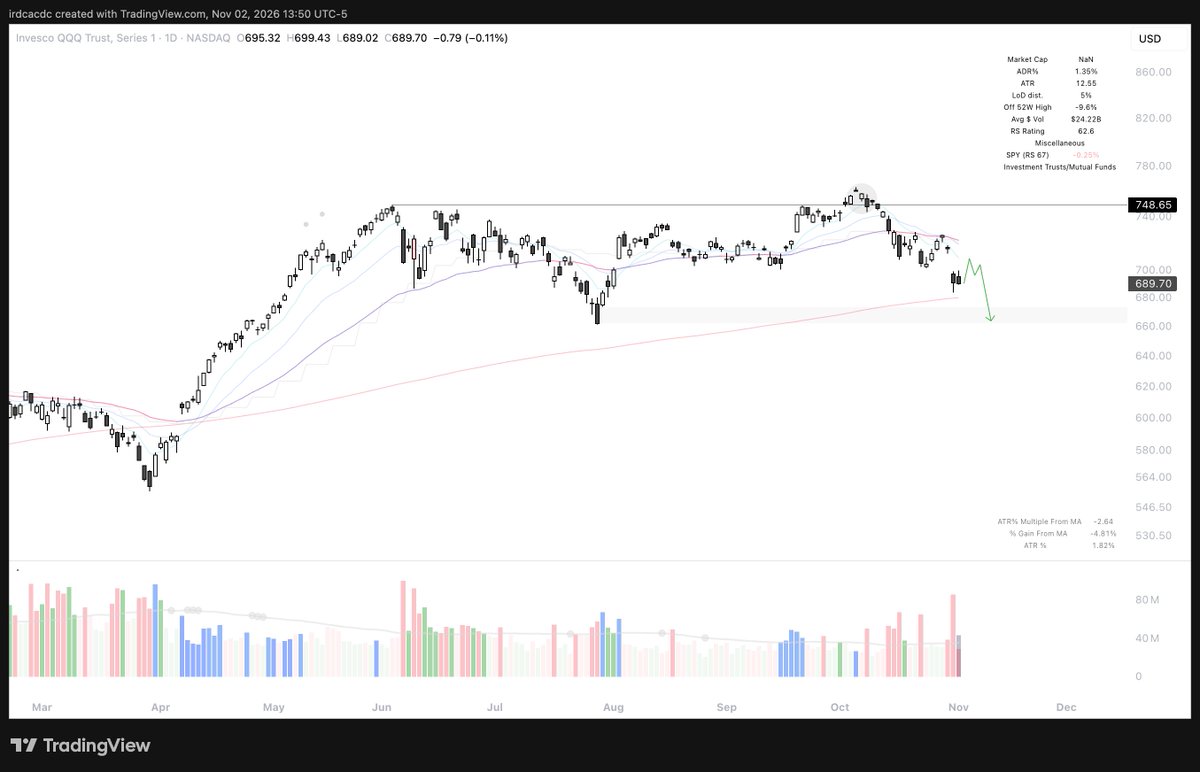
I still think there's more downside on $QQQ ahead. I want to see some real fear + capitulation flush out the weak hands before I start getting aggressive on the long side again...let the market throw its little tantrum first.
Nasdaq $QQQ has seen significant distribution lately, and we're approaching correction territory (-10% from the highs). After Friday's gap down, $QQQ is now facing rejection near Friday's highs. There's a good chance we test the 200-day SMA, and that's where we'll need to see whether buyers step in. If that level fails, the next major support is around the double-bottom area in the $660s.
$SMH is barely holding its 200-day SMA, while many semiconductor leaders are already trading well below theirs. I'd be cautious about picking long ideas in the semiconductor sector right now. It's better to wait for these names to complete their Stage 4 declines and start building Stage 1 bases, which could mean sideways price action for weeks or even months.
Midterms are tomorrow, and I think some of the negative catalysts may already be priced in, which could explain why $QQQ is approaching correction territory. At the same time, I really don't like seeing earnings-related gap-downs in major names like $GOOGL and $INTC. Ideally, if the market is going to establish a new uptrend and produce the next generation of leaders, here's what we want to see:
- A Follow-Through Day (FTD) on the major indexes.
- Powerful earnings gap-up candles (PEGs) following strong earnings reports.
- More Stage 1 bases forming with signs of institutional accumulation.
- More stocks making new 52-week highs and fewer stocks making new lows.
So far, we're not seeing enough of these signals to suggest a sustainable new uptrend.
Until then, focus on building your watchlist, identifying stocks showing relative strength, and studying which sectors are holding up better than the broader market.