Want to get a quick data health check for your Shopify store? Our free data audit report can help you identify your business's strengths, opportunities, and threats.
Get your report: https://t.co/0ZlzeAZo4y
📊 January 2024 DTC E-Commerce Performance Metrics:
Total number of orders analyzed: 583,026 (+10.04% YoY)
Total Revenue: $46.8M, +10.09% YoY
Average Revenue per Store: $712.8K, +11.24%
Total Customers: 519.2K, +8.73%
see thread for more
#ecommercebenchmark@treslco
📈 Year-end e-commerce strategies! How are successful brands already winning in 2024?
Read @geosylv's insightful blog on closing out the year strong and how to set up for a successful 2024. Here’s the lowdown for all you e-commerce marketers out there:
1️⃣ BFCM may be over, but the biggest sales week is yet to come – the holidays! “Last chance to order before Dec 25th” email flows are huge revenue generators! George suggests leverageing these flows along with countdown timers on your site to increase conversions and boost last-minute revenue for 2023!
2️⃣ Long-term planning is key. The best brands are already knee-deep in 2024 planning. Take notes from your best-performing (and worst-performing) ads and strategies this year.
3️⃣ Simple sales work amazingly. Forget complex offers; opt for simple, direct discounts for a better response from customers. It's the uncomplicated way to boost sales.
4️⃣ Discounts = more profit than you think. Don't underestimate discount periods – going big on ads when offering discounts can surprisingly up your profit game.
5️⃣ Refresh your Meta audiences! Updating them ensures your ads reach the right people, reducing wasted spend and boosting ROI. Keep your targeting sharp for 2024 - it's essential for smart, efficient marketing.
Dive deeper with George’s full blog for more comprehensive e-commerce strategies: https://t.co/yX320gU8gt
#EcommerceStrategy
@Shopify reported $9.3B in sales over BFCM — a 24% increase, but more importantly, how did #BFCM2023 go for you? If you're seeing lots of abandoned and wondering how you can get to break-even quickly, here are 2 segmentation ideas for you! Read on below👇
Segment of the week: BFCM first-timers and Abandons
Why you should care:
Our data shows that first timers during BFCM are 25% less profitable given the insanely high CAC. What can you do to get to break-even faster?
1.BFCM first-timers—keep them engaged
Filter: “First order date between Nov. 24 to Nov. 27”
New customers acquired during BFCM are likely deal hunters. 🈹
- segment them out and put them in a separate follow-up flow
- track the performance in monthly cohort
See thread for segment #2.
#postbfcm @treslco@Shopify
OUr data analysis showed the top brands that outperform their peers during #bfcm create twice as many campaigns (median of 32 campaigns). How many have you planned?
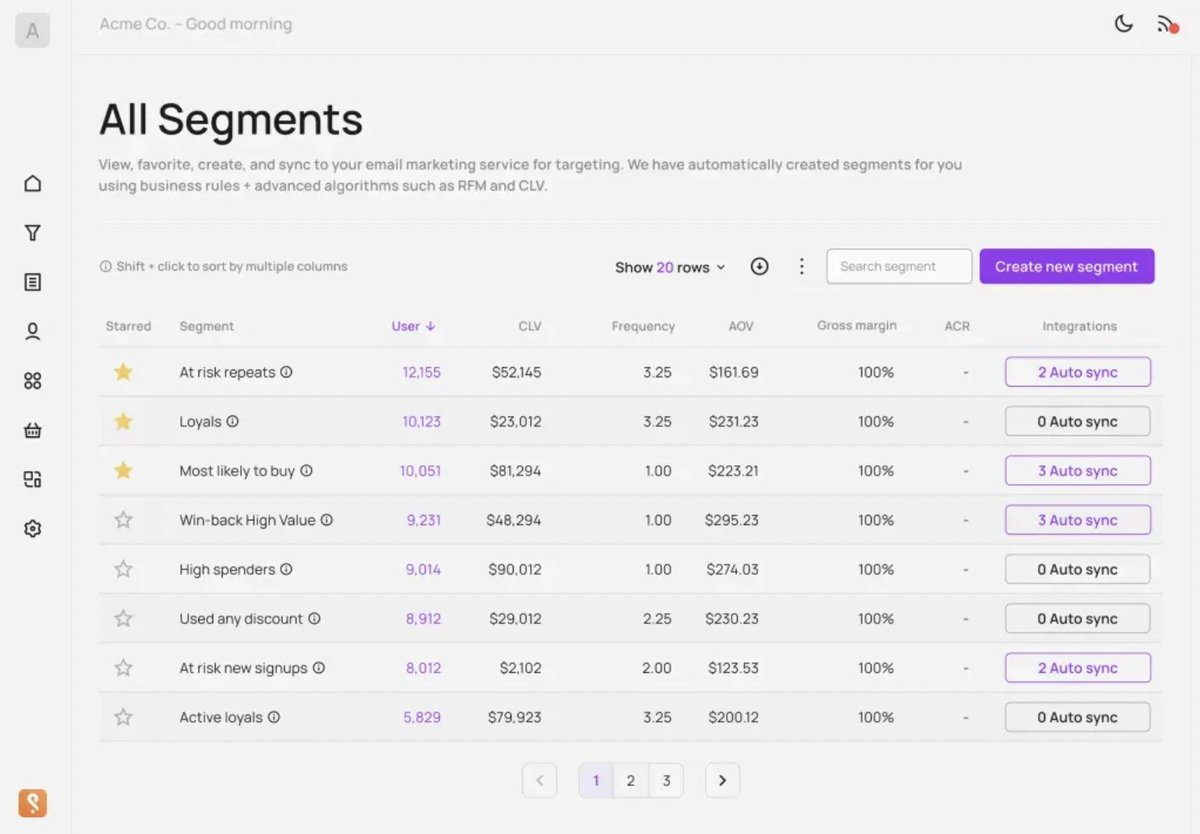
Here are the Top 5 BFCM segments you should target 🎯 to help you kick things off
@treslco@ShopifyPlus https://t.co/2Dy6u3qZJg via @LinkedIn
🙌 Our first #Shopifyflow template: schedule and generate reports is live @Shopify and @ShopifyPlus merchants can now schedule performance metrics, top product cross-sell, and monthly benchmarks in their inbox for free. Thanks to @thenuschke for your help!
#makedataeasy@treslco
We've been working with @geosylv for a year now and he's been a fantastic asset to our team, insanely helpful and resourceful. FYI, he used to run everything marketing at @FellowProducts
When someone that good puts down #bfcm tips, you should pay attention.
Tip #1 Test your Holiday Ad Creative Now
Hey merchants,
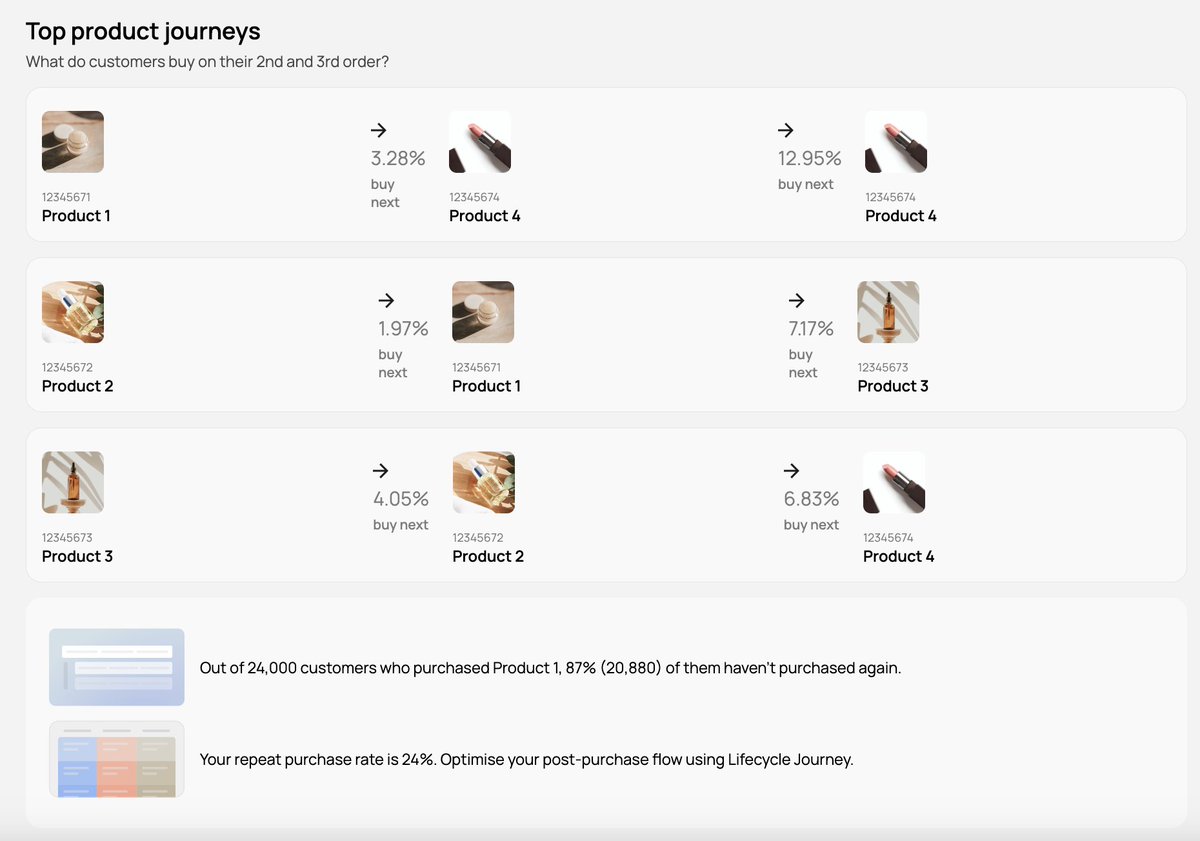
You can now use Shopify Flow (free) to get free insights 📊about your store using the Scheduled Time trigger and Tresl Segments. It takes ~5 minutes to set up and doesn't cost anything. You get product journey analysis, replenishment rates, purchase timing, and more.
Click the link to see how to set it up!
@Shopify@ShopifyPlus
https://t.co/qLsWaSgRBc
📊 September vs. August 2023 DTC Benchmarks:
Total number of orders analyzed: 588,892 (-2.66%)
September avg. revenue: $1.03M (+1.78%)
AOV (Average Order Value): $129.32 (+0.92%)
ARPU (Average Revenue Per User): $141.57 (+0.67%)
Email open rate: 53% (+2.71%)
Email click rate: 3.3% (+34%)
Top-performing categories:
Apparel: 2% growth in revenue with an AOV of $138.96.
Beauty & Fitness: 6.8% growth in AOV
How do these benchmarks align with your store's performance?
#ShopifyBenchmarks #DTCInsights
#TreslSegments
3/ Leverage these insights to optimize your October email campaigns and drive engagement and sales!
Like this thread and DM us to receive a PDF copy of the detailed October E-commerce Email Campaigns Guide! Or just check it out directly here: https://t.co/IYFU01eB3S
📢 Exciting News! We've analyzed October's E-commerce Email Campaign data to help you craft more data-driven and effective campaigns! 🚀
Here’s a sneak peek into the insights and suggested campaigns for October 2023!
2/ 📈 Insights from October 2022:
Peak engagement dates: 1st, 15th, 27th, 30th.
Average store revenue ranged from $28,540 to $31,250.
“Exclusive”, “Limited Edition”, “Halloween” were click-magnets!