@447ThomasHoward Please read the thread. A number of people are leaving drive by comments based on the first tweet. In the thread I calculate under reporting rate.
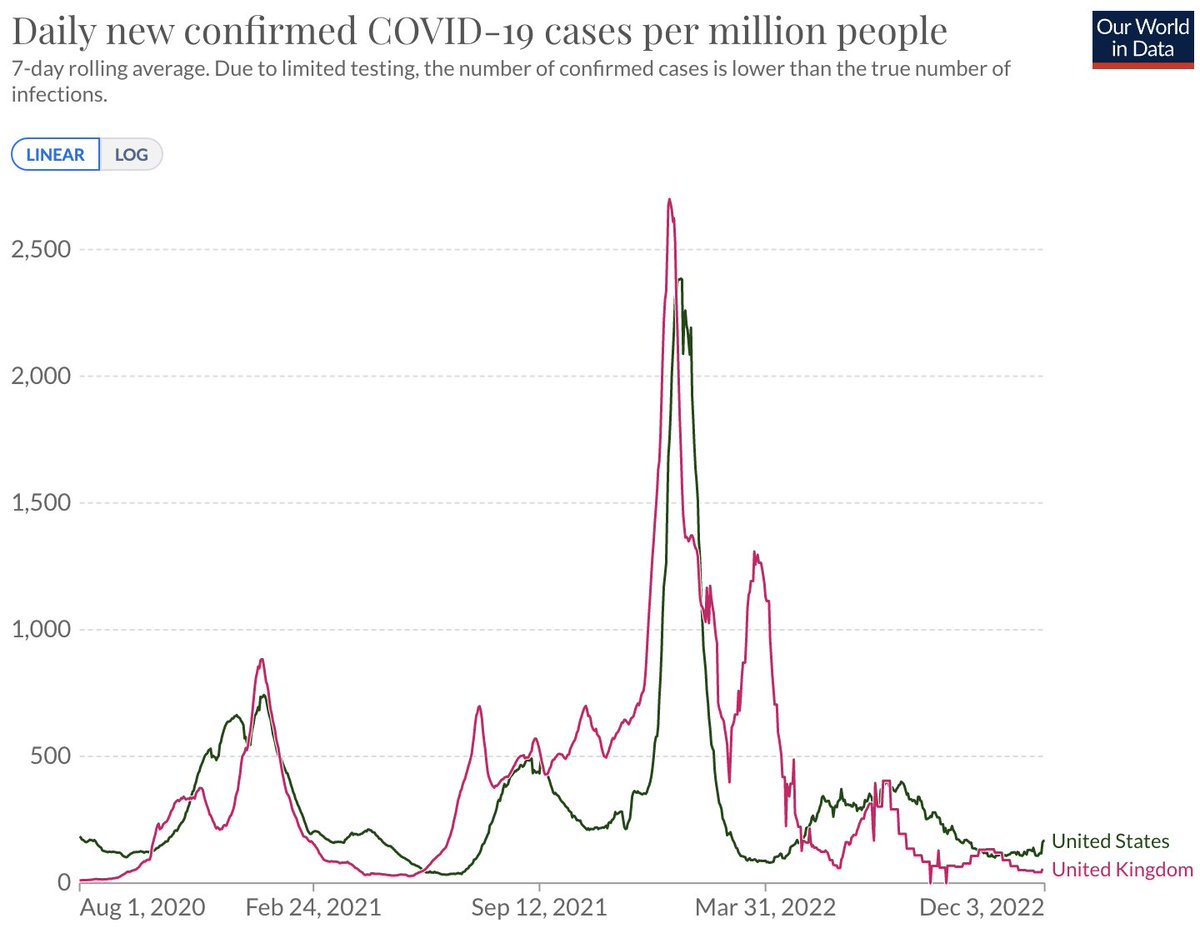
Currently, the US is reporting about 54k daily cases of COVID-19 (16 per 100k per capita) and the UK is reporting about 4k (6 per 100k). This seems comfortingly low compared to even this summer's BA.5 wave and let alone last winter's BA.1 wave. Figure from @OurWorldInData. 1/16
Unfortunately, I'm not sure how best to extrapolate this number to the US, as I believe that testing has declined more in the UK than in the US. However, the ~10-fold difference between a year ago and today is absolutely striking and may suggest a roughly similar decline. 11/16
@dbweissman I don't have a good sense of this. I do think the per-infection rate of long COVID has likely declined as we've generally seen long COVID associated with greater severity. But I don't know if reduction will match the 10-fold reduction in IFR.
We have a situation of continued substantial circulation, but with per infection risk of death similar to influenza. Though this is not accounting for long COVID which alongside greater circulation places health burden of COVID substantially higher than influenza. 16/16
This would imply a crude infection to fatality rate (IFR) of 17514/25.8M = 0.07% or 1 death in ~1500 infections, which fits with broad expectation for current IFR. If instead we use deaths with COVID on death certificate we get an IFR of 0.04%. 15/16
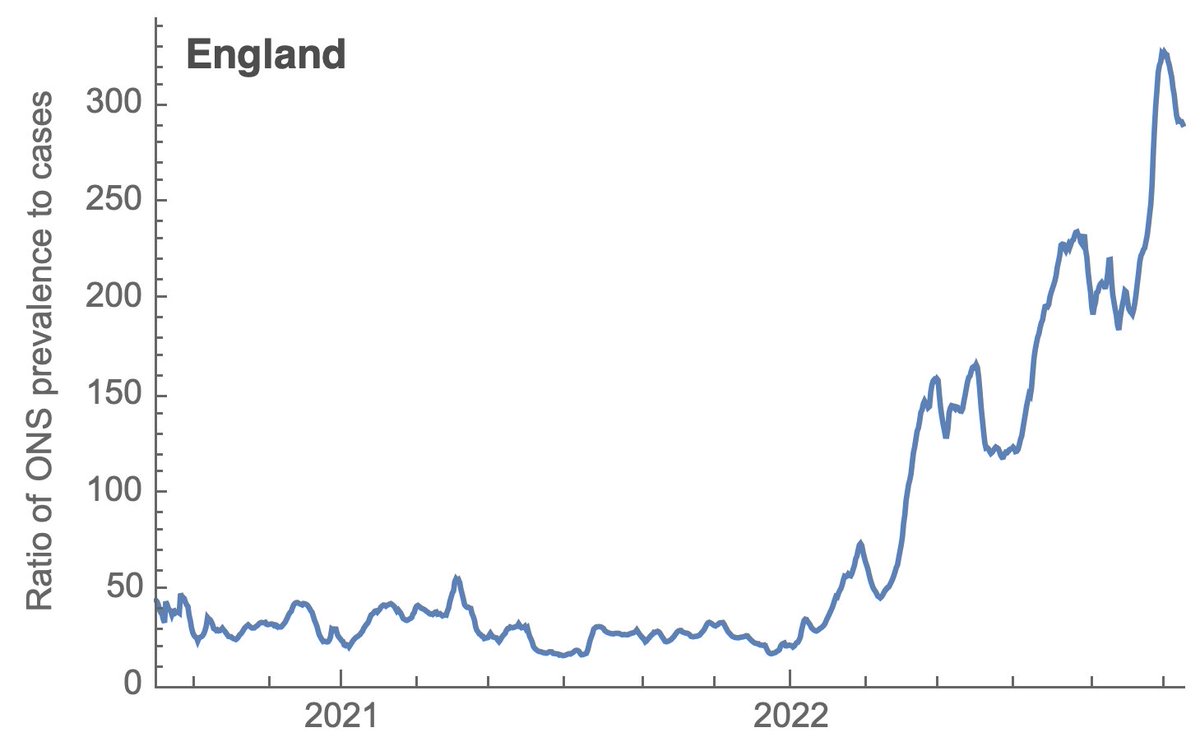
Likewise, the current 300-fold ratio can be converted assuming the average infection tests positive for 8-days in 2022 (https://t.co/jUO7K3rBJf). This would imply a current case detection rate of 1 case per ~38 infections. 10/16
The 30-fold ratio can be converted into case detection rate by dividing by the span of time during which the average infection tests positive. I'll use 10-days for the pre-Omicron period (https://t.co/aB6XryK1De). This gives a detection rate of 1 case per ~3 infections. 9/16
If we take a ratio of ONS prevalence to daily incidence, we get the following where the ratio is fairly constant at ~30-fold throughout 2020 and 2021, but increases sharply throughout 2022 and is now perhaps ~300-fold. 8/16
If we compare daily cases to prevalence we see an interesting result, where there is a consistent relationship in 2020 and most of 2021 (blue and yellow points), and a shift in 2022 to a steeper relationship where fewer cases correspond to greater prevalence (red points). 7/16
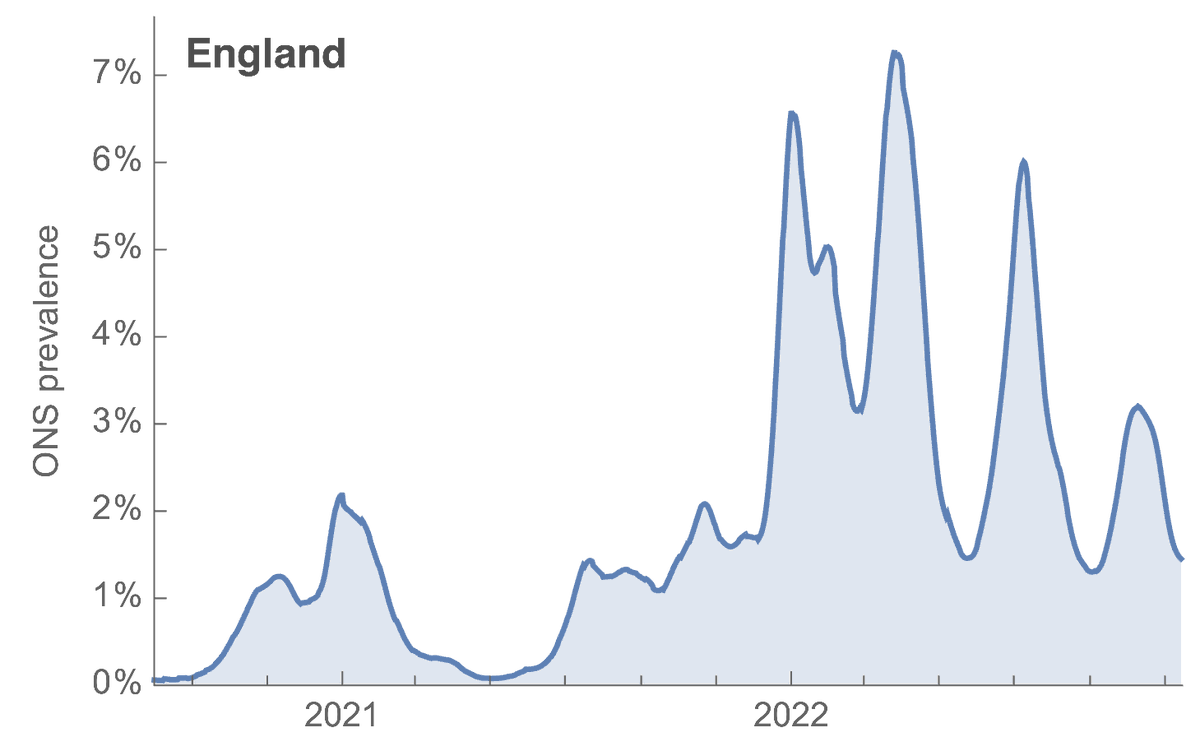
While here I'm showing estimated prevalence (proportion of individuals testing positive) from the @ONS infection survey (https://t.co/pjCJZ64N2E). The initial Omicron surge results in the most concurrent infections, but later waves in 2022 result in comparable prevalence. 6/16
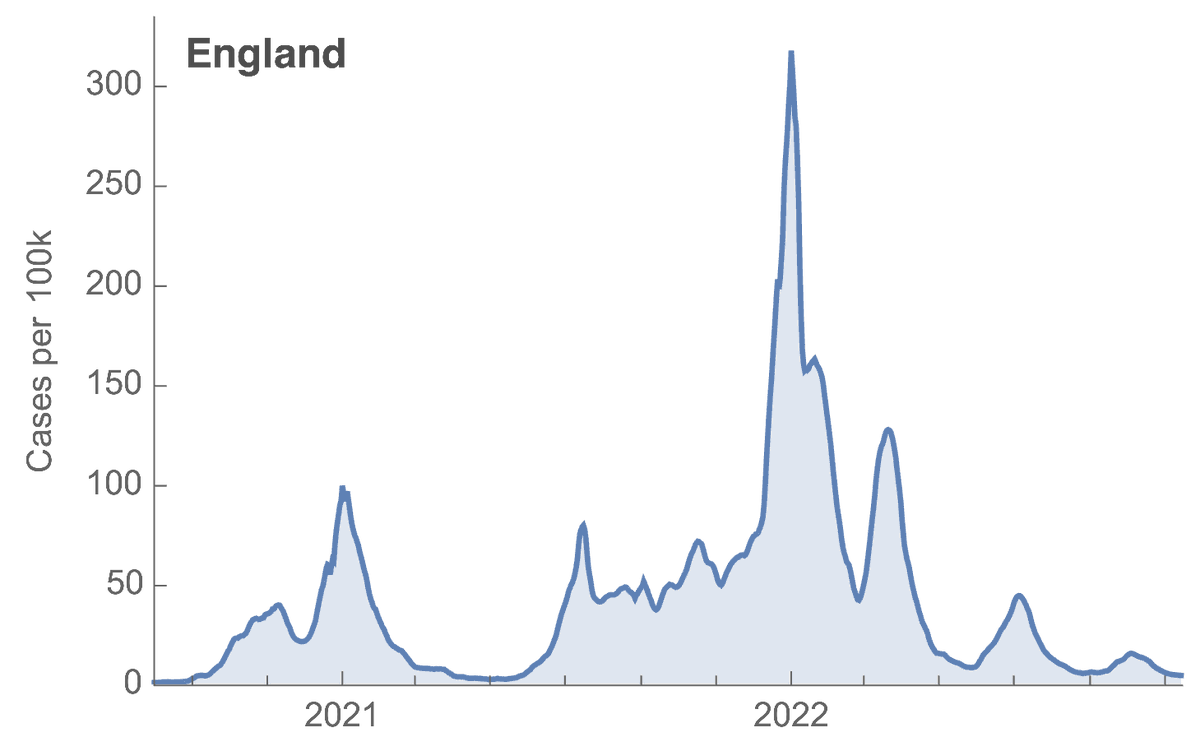
Here, I'm showing per capita case counts for England for Aug 2020 to Nov 15, 2022 using data from @UKHSA (https://t.co/4cr1ySMzX6). The spike from the initial Omicron surge is quite evident and nothing in 2022 compares to this. 5/16
Although there are things like wastewater surveillance in the US, I believe the gold standard to assess case detection rate is the @ONS infection survey (https://t.co/Wo9jctWBvi) that has continued to test swabs every week in the UK regardless of individual's symptom status. 4/16
We're interested in the case detection rate or the ratio of underlying new infections compared to reported cases. Throughout much of 2020 and 2021, I had a working estimate of 1 infection in ~3.5 getting reported as a case. 3/16
https://t.co/sQBkQxNz1S
Historically, I have assumed that around 30% of infections in the US are reported as cases. This number was derived from seroprevalence and modeling estimates from sites like (no longer updated) https://t.co/Dy3hQiJkR0. 3/15
However, at this point, nearly all infections will be in individuals with prior immunity from vaccination or infection and this combined with a roll back in testing makes it unclear how to interpret current case counts compared to previous time periods. 2/16