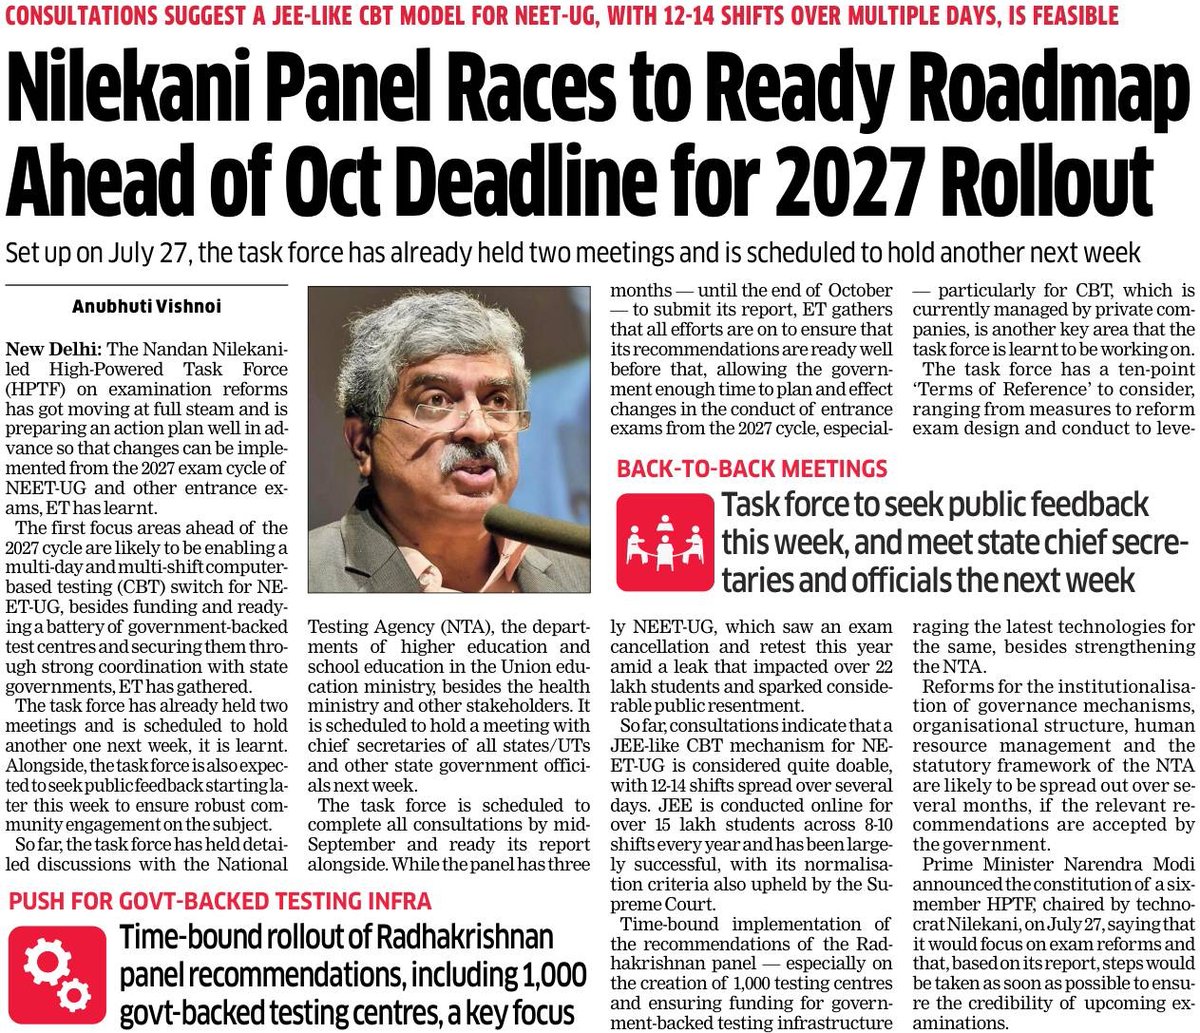
NEET-UG moving to a JEE-style multi-day, multi-shift CBT model was always the logical way forward.
With 12–14 shifts spread over several days, the system can dramatically reduce the risks of a single-day exam with normalisation.
The other crucial piece is permanent, government-backed testing infrastructure. Building a network of around 1,000 centres, as envisaged by the task force, is far more sensible than counting on rickety private capacity every exam cycle.
What is harder to explain is why this model was not adopted much earlier. The charitable explanation is institutional turf wars between the Health and Education ministries. The more disturbing possibility is that too many interests in sustaining the system rife with leakage and manipulation via @EconomicTimes
Until 1991, India kept its economy largely closed and state-controlled. Licences, quotas and public-sector dominance suffocated private enterprise, leaving it with little room to contribute to India’s growth story.
1991–96: The balance-of-payments crisis pushed India to the brink. The choice was stark: open up or risk economic collapse. Licensing was dismantled, monopolies rolled back, FDI opened and private enterprise finally got room to scale.
Atal Bihari Vajpayee: Reform became a choice, not a compulsion. Telecom, insurance, roads, ports, aviation and power opened to private participation, creating entirely new markets and opportunities.
Manmohan Singh era: The opening became much more limited, largely around retail, real estate, construction and selected services. Several major sectors remained closed to meaningful private participation.
2014 onwards: The biggest wave of opening returned, defence, coal, railways, drones and space, with private capital and Indian entrepreneurs entering sectors once dominated by the State.
From a country where businesses needed permission to expand, India is moving towards one where more Indians can build.
Open More. Build More. Grow More.
KA politicians don’t want anything to develop beyond Bengaluru.
Kalaburagi &Bidar should have been developed as a proxy to Hyderabad. Instead they dump everything into Bengaluru because these bevarshi’s have their real estate money here.
And, they are killing our rivers.
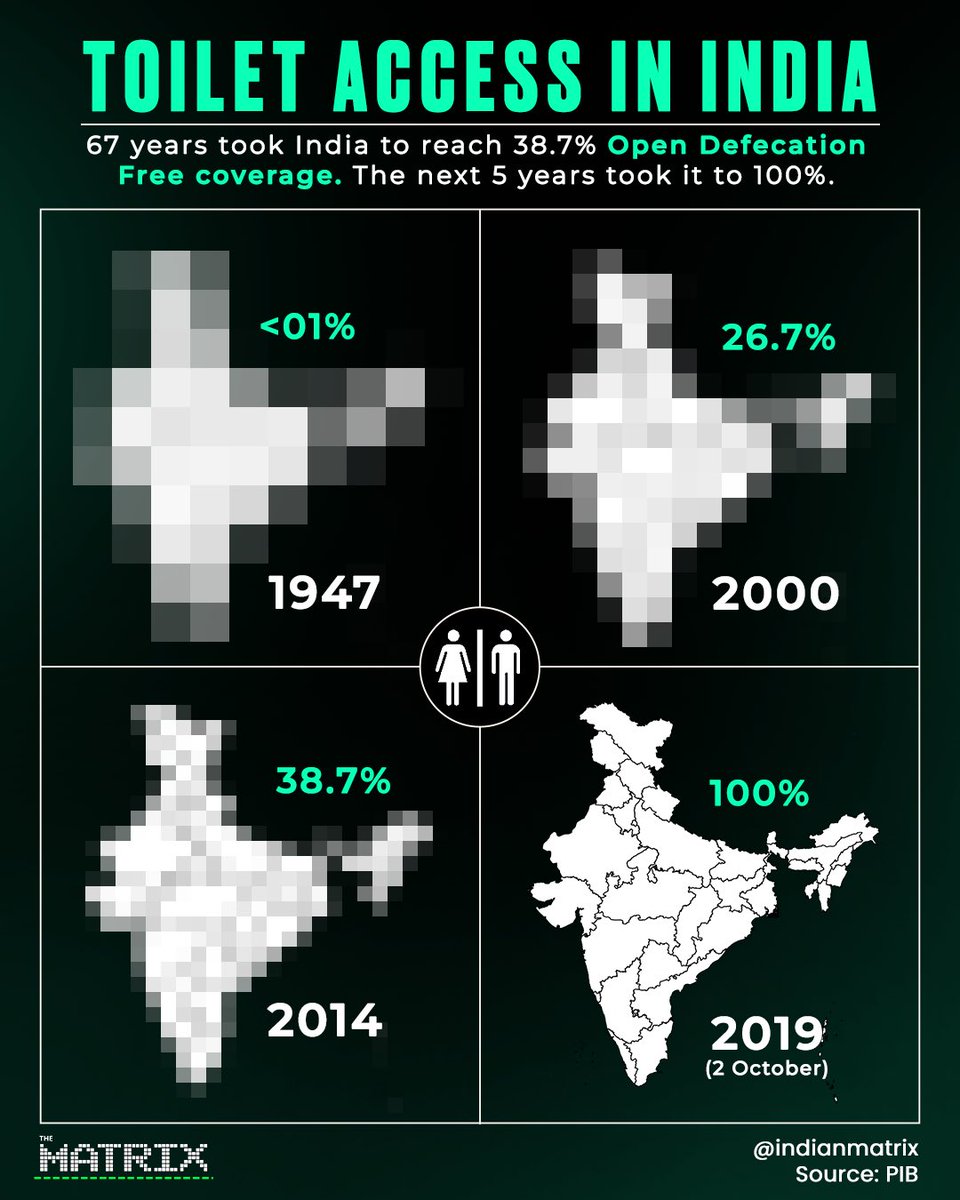
From less than 1% Open Defecation Free coverage in 1947 to 38.7% in 2014, India’s sanitation journey took decades.
The next five years saw a rapid acceleration, with India reaching 100% ODF coverage in 2019 under the Swachh Bharat Mission.
The pixelation reflects the percentage: higher coverage means greater image clarity, while lower coverage appears more pixelated.
67 years to reach 38.7%. Then 5 years to reach 100%.
INDIA PRODUCES ALMOST NO OIL. YET IT IS REPLACING THE UAE & SAUDI AS KENYA’S FUEL SUPPLIER.
That tells you everything about the oil business. It’s not just about who has crude. It’s about who has refining capacity, scale, logistics, market access.
India has acquired the ability to turn imported crude into finished fuels for the world!
ಮಂಗಳೂರು ಭಾಗವನ್ನು ನೈಋತ್ಯ ರೈಲ್ವೆ ವ್ಯಾಪ್ತಿಗೆ ಸೇರಿಸುವ ವಿಚಾರದಲ್ಲಿ ಕರ್ನಾಟಕ ಸರ್ಕಾರ ಮತ್ತು ನಮ್ಮ ಕೆಲ ಜನಪ್ರತಿನಿಧಿಗಳ ಮೌನ ಏಕೆ? ಕರ್ನಾಟಕದ ಪ್ರತಿನಿಧಿಗಳ ಮೌನ ನಿರಾಶಾದಾಯಕ ಮತ್ತು ಖಂಡನೀಯ. ಮಂಗಳೂರಿನ ಹಕ್ಕು ಹಾಗೂ ಹಿತಾಸಕ್ತಿಗಾಗಿ ಈಗಲಾದರೂ ಸರ್ಕಾರ ದೃಢವಾಗಿ ಧ್ವನಿ ಎತ್ತಬೇಕು.
#ಮಂಗಳೂರು#ಕರ್ನಾಟಕ#ನೈಋತ್ಯರೈಲ್ವೆ
VIP treatment, MP edition:
A fire brigade has reportedly been called in to wash the Singrauli MLA’s car.
Because apparently, even a bucket of water is too ordinary for VIP culture.
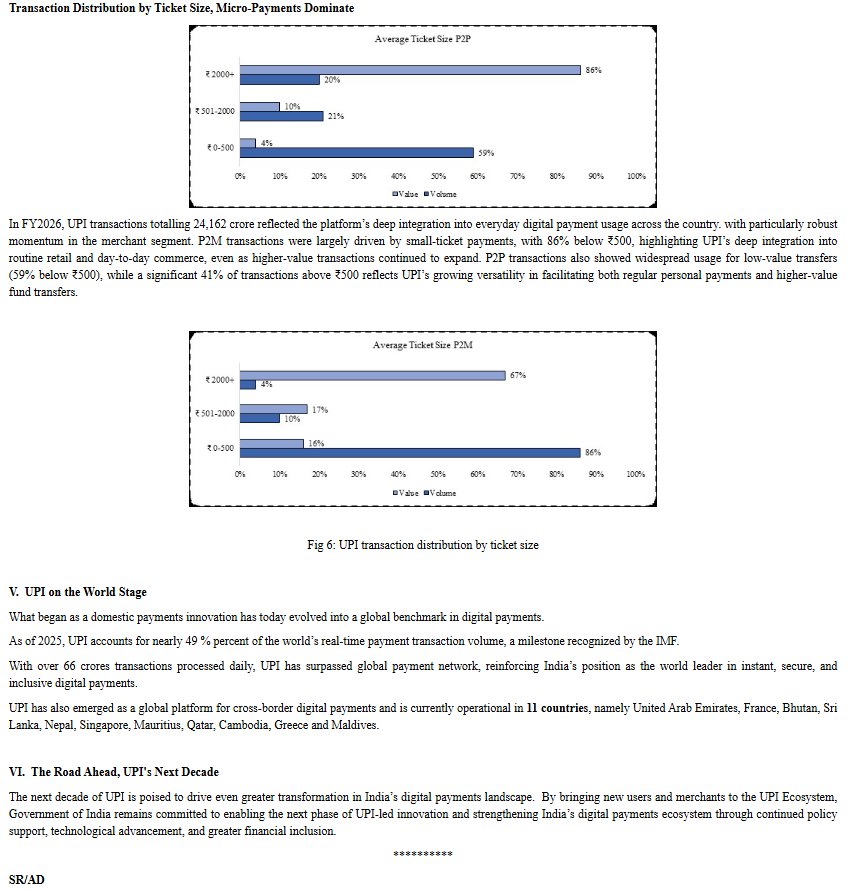
Today, UPI is the world’s largest real-time payment system, accounting for 84% of India’s digital payment volumes and serving 55+ crore active users.
Its success rests on a powerful foundation built since 2014, Digital India built the digital rails. Jan Dhan brought millions into the banking system; Aadhaar provided the identity layer and mobile connectivity put digital services in every hand.
Launched in 2016, UPI brought these building blocks together to create the world’s largest real-time payments ecosystem. via @businessline
India has achieved a rare milestone in banking:
For the first time, no listed Indian bank had a Net NPA above 1% in Q1 FY27.
A decade ago, Indian banks were buried under bad loans. The turnaround was driven by structural reforms:
>Asset Quality Review (2015)
Uncovered hidden stress.
>Insolvency & Bankruptcy Code (2016)
Strengthened recovery and credit discipline.
>PSB Recapitalisation (2015–19)
₹3.19 lakh crore+ recapitalisation helped strengthen PSB balance sheets.
>Bank Consolidation (2017–20)
Created stronger and more resilient banks.
>EASE Reforms (2018–present)
Continuous reforms to strengthen governance, risk management, and digital banking
>Stronger monitoring & risk management
Continuous reforms to strengthen governance, risk management, and digital banking.
Cleaner banks.
Stronger balance sheets.
More room to lend and support India’s growth.
India’s steel story is getting harder to ignore.
From 68.3 MT in 2010 → 164.9 MT in 2025, a 2.4× increase in 15 years.
India is now the world’s #2 steel producer, behind only China.
In 2025, India produced more steel than the US, Japan, Russia & South Korea individually.
And it’s still growing, 10.4% higher than 2024.
From 68 MT to 165 MT.
India is building at scale 🔥
✅#UPI Completes 10 Years of Digital Payments Revolution- Globally Recognised as World’s Largest Real‑Time Payment System
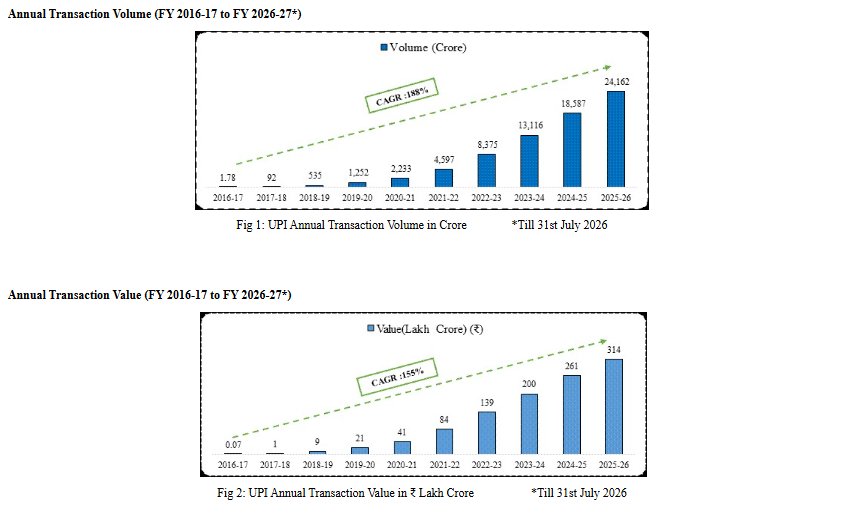
✅ Almost 13,000-fold Surge in Transaction Volume, Annual Transaction Volume Expands from 1.78 crore transactions in FY 2016-17 to over 24,162 crore transactions in FY 2025-26
✅ Transaction Value Rises from ₹0.07 lakh crore in FY 2016-17 to around ₹314 lakh crore in FY 2025-26, showing an almost 4,000‑fold Increase
✅ UPI is Presently Operational in 11 Countries, Emerges as a Global Platform for Cross-Border Digital Payments
✅ Number of Banks Live on UPI Increase From 44 in FY 2016-17 to 703 in FY 2025-26, Enabling UPI's Deep Geographic Reach and Financial Inclusion
✅ UPI’s Success Underscores India’s Leadership in Building Scalable, Inclusive, and Innovative Digital Public Infrastructure
🔗 Read more at: https://t.co/gjb68vMdGp
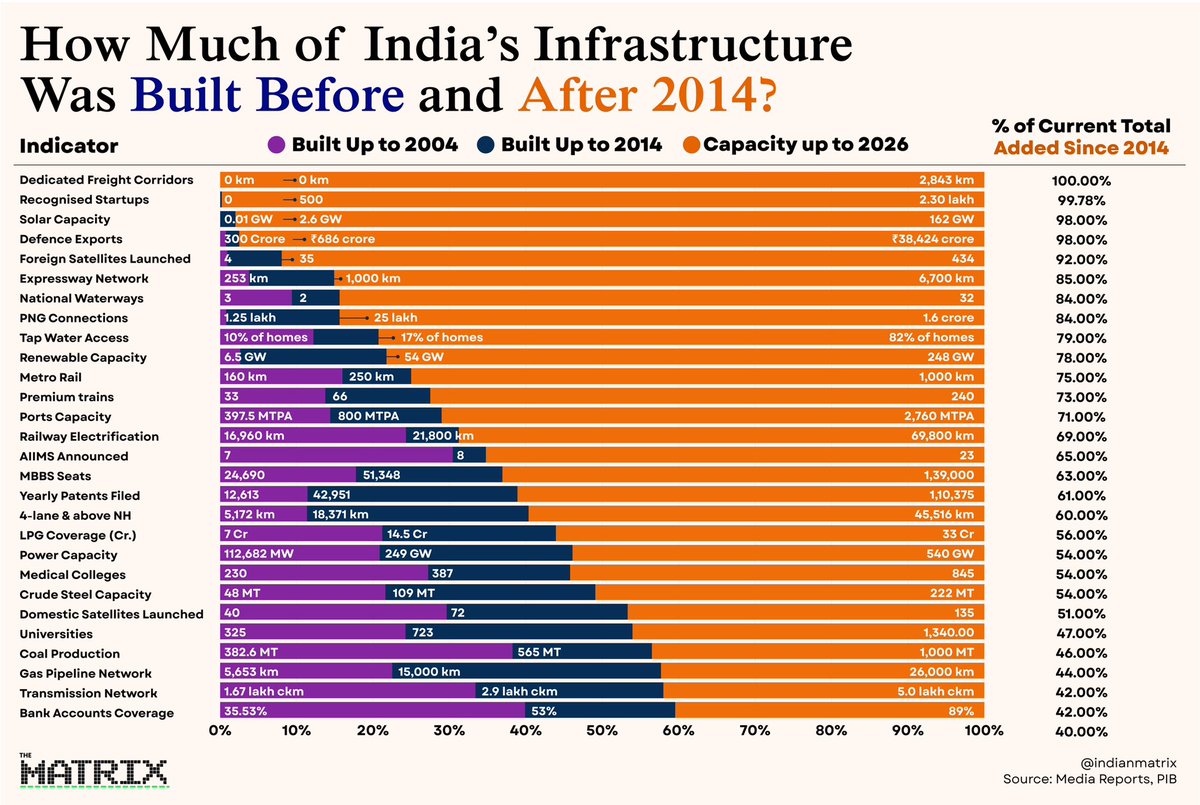
How much of India’s infrastructure was added after 2014?
A comparison with the preceding decade puts the scale into perspective:
Indicator | 2004–14| 2014–26
DFC | 0% | 100%
Solar | 2% | 98%
Ex. Ways | 11% | 85%
Tapwater | 7% | 79%
Metro | 9% | 75%
Port Cap | 15% | 71%
Rail Elec | 7% | 69%
4Lane NH | 29% | 60%
Infrastructure is built over decades.
But some decades build more than others.