We're excited about our workshop leaders at #RiceVCS this week! @W_R_Chase will teach us about "Telling Data Stories with ggplot" and Vivian Peng (@create_self) will help us create "Interactive data visualizations."
Monroe. N. Work compiled most of the data on African Americans @TuskegeeUniv starting in 1908 to the 1940s. He was a data pioneer that helped fuel the cause of racial justice with facts. #BlackHistoryMonth /🧵: https://t.co/dE7sBPcKiy
Rice's Fondren Library is the only place in North America where you can see a working replica of the printing press used by Romantic poet and artist William Blake. See it in action, along with recreations of Blake’s masterworks, March 1. https://t.co/kKMhHktiUw
We've added a new data story to the #Data4Kids page (#dataviz folks will recognize it). Free slides, data, and details for instructors across multiple content areas to help teach kids (K-12) more about data, data privacy, and data visualization. | https://t.co/vlVh4SLGH1
Next week, I'm joining @NORDP_official friends at the Rice U. Visual Communication Symposium. I’ve been wanting to go to this symposium for years, and now I am—as a SPEAKER! I also learned that my talk is immediately following @jschwabish. (Shameless fan moment—buy his book!)
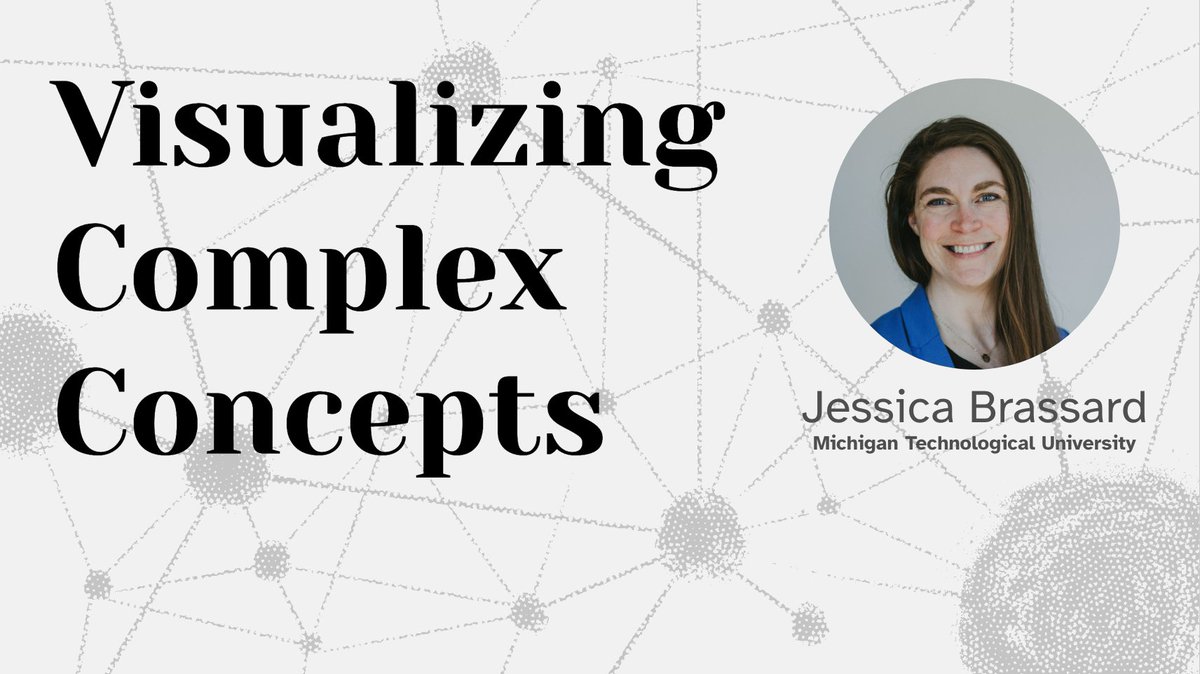
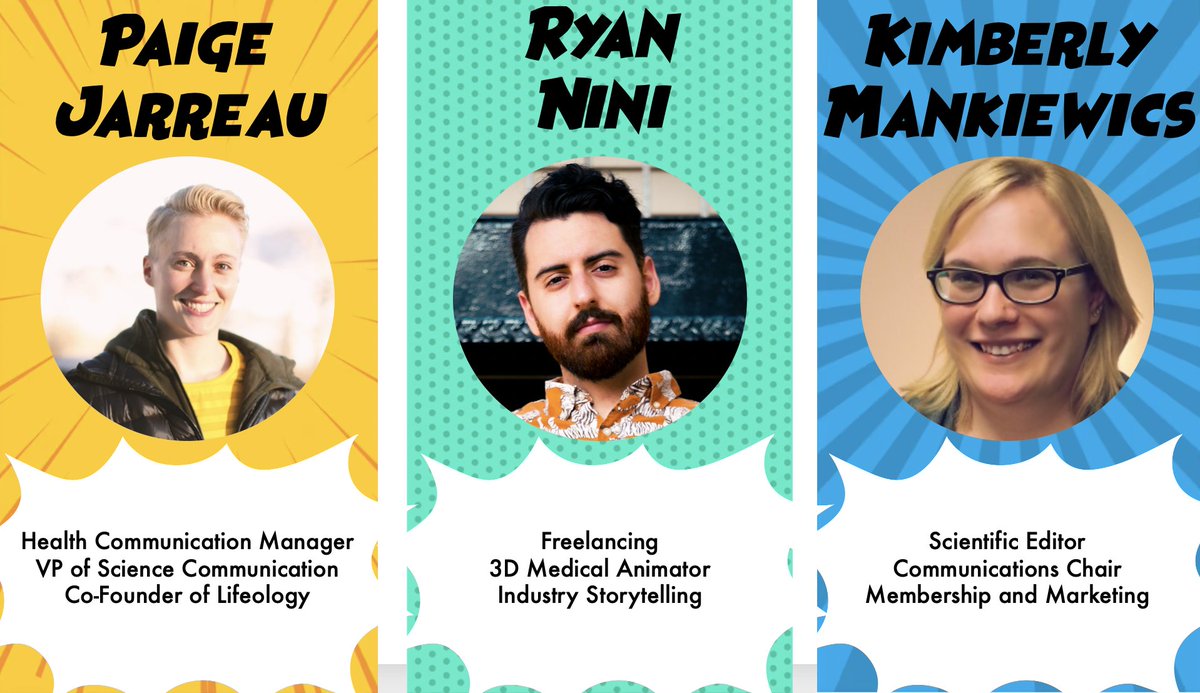
Our first panel, Science in Multimedia, was all about how to use media (visual, written, oral, and more!) to convey science to the public and to other scientists. Thank you to @FromTheLabBench, Ryan Nini, and Kimberly Mankiewics for traveling to Houston for our event!
Time for our "Bringing People Together" panel about how to bridge the gaps between scientists and the community. Thank you to Maria Bottazzi @mebottazzi, Chris Volpe @ScienceIsHope, and Alex Ip @AlexIp718 for joining us, it is an honor to have all of you!
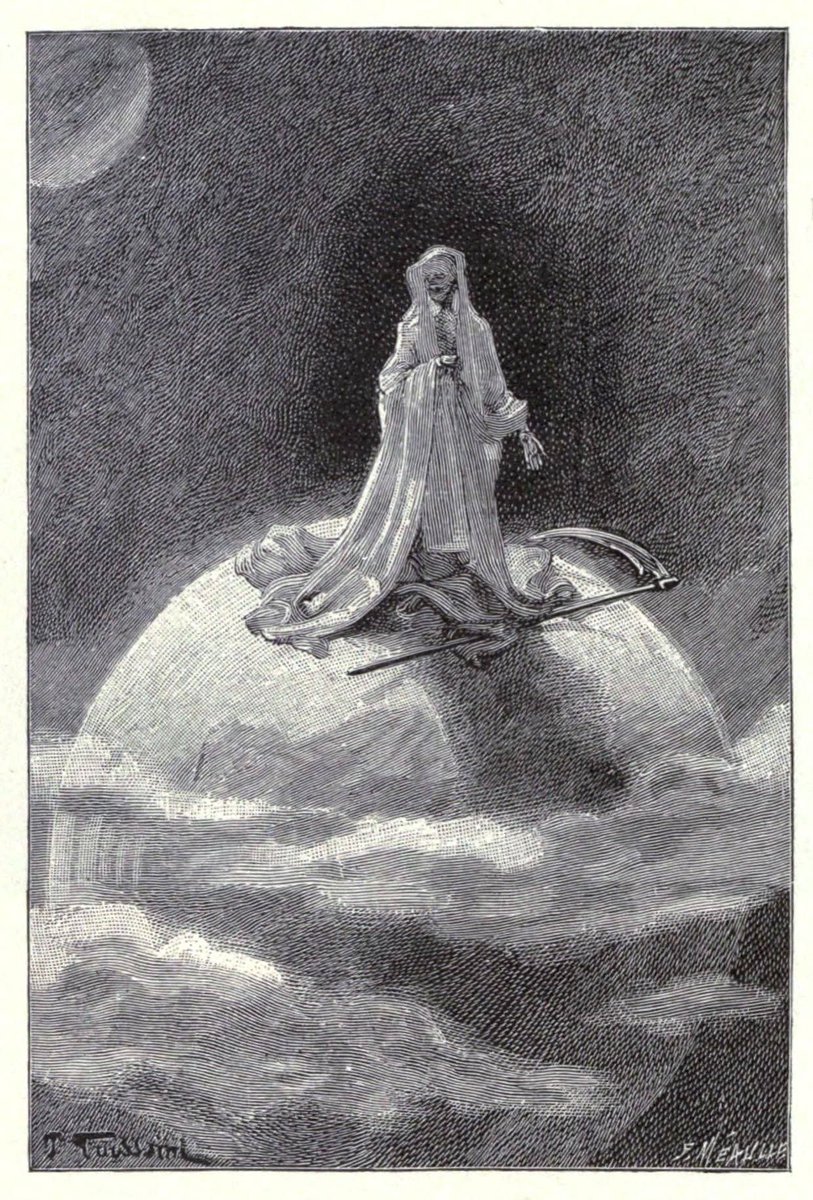
One of the many wonderful illustrations featured in Omega: The Last Days of the Earth (1894), a #sciencefiction novel by 19th-century French astronomer and writer Camille Flammarion, who was born #onthisday in1842. More here: https://t.co/eKkAbotEBd #OTD#scifi
Another speaker at VCS 2023... @vsetlur, Director of Tableau Research and co-author of "Functional Aesthetics for Data Visualization"! To register for the symposium being held at Rice University March 2-3, visit https://t.co/fi6AAZUazt
Latest @PolicyViz podcast episode! Learn more from @vsetlur & @WindsCogley about how they met, their new book, and how to build effective #dataviz in organizations. |
🎙On the site & your favorite podcast provider: https://t.co/oHKB4Mg6qI
📺On YouTube: https://t.co/7TTkS8cVT4
Amazing replies to this tweet on adding curvy arrows to your #Rstats plots! Here are four resources folks shared:
➡️ @MattCowgill: https://t.co/oeA768bUrr
➡️ @rappa753: https://t.co/z9K1UdKkiM
➡️ @CedScherer: https://t.co/XI4K0RnNne
➡️ @cararthompson: https://t.co/3UcqA6y2fX
🚨This just in!🚨 You can now make a highly customizable 2D phylomorphospace in #ggplot2 📈with the new geom_phylomorpho function in the development version of my #deeptime R package 📦:
https://t.co/zEHKHSqVb1
#rstats#phylogenetics
Can internet use become addictive?
A #SciencePerspective from last year discusses the addictive potential of the #internet and how it can be best conceptualized and evaluated. https://t.co/O0dTUsb7RA
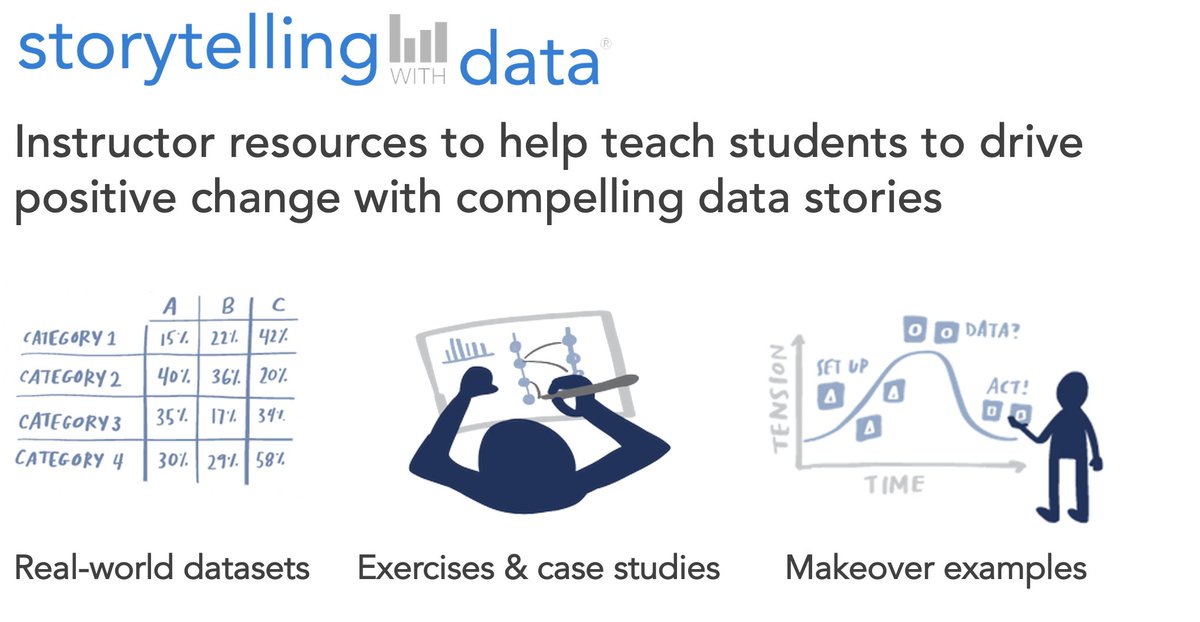
Do you—or would you like to—teach from SWD books? Let us know & check out our free university instructor resources: datasets, exercises, case studies, videos, podcasts, special office hours & more to assist your teaching! https://t.co/yOlI1tzHfC
A year of amazing data, tech, and equity blog posts from the amazing #DataAtUrban blog from @urbaninstitute. | Data@Urban’s Top Posts of 2022
https://t.co/dIlb0KWIAa
We're excited to announce our speakers and workshop leaders for #RiceVCS 2023!
Our keynote speaker this year is @jschwabish. Dr. Schwabish is founder of the data visualization and presentation skills firm, @PolicyViz, and a Senior Fellow at the @urbaninstitute.