@XpertPATrader Impressive! I am a Stockbee member. I only trade the 1st hour due to full time job. Looks like your process has evolved from stockbee days . Do you have discord that I can join, or is there a document that you can share that details your process? thank you.
If anyone tells you that in order to be successful in trading you need to make some unknown discovery on your own... This is a lie!!
- I learned about volatility contraction and progressive exposure from Mark. @markminervini.
- I learned about momentum bursts and Episodic pivots from Pradeep @PradeepBonde
- I learned about the importance of creating a model book for myself with 100s of past examples. As well as the idea of focusing on higher ADR stocks from Kristjan @Qullamaggie
- I learned about stage analysis from Stan @StanWeinstein13
- I learned how to read and interpret COT data from Jason @Crowded_Mkt_Rpt
- I learned the right side of the V concept and proper bet sizing on A+ opportunities from Lance @TheOneLanceB
- I learned to think a little more contrarian from watching @TheShortBear
- I learned about the flat base breakout and value in leading groups from @PatrickWalker56
- I learned about the HVC/HVE edge from @AmeetRai
- I learned about trading more aggressively during high momentum periods from @DanZanger
- I learned about the Undercut and rally or Double top short sale setups from Gil Morales @gilmoandco
- I learned how to think about creating and implementing systems from @Peoplewish
- I learned the failed follow through setup on an intraday timeframe from @InvestorsLive
- I learned about the importance of prior day channels from @danshep55
- I learned about support and resistance gaps for entries from @NickDrendel
- I learned about using the 50sma as a guide to measure extensions from @jfsrev
- I learned about creating a daily trading plan from Marcel Link.
- I learned about the CANSLIM methodology from Bill O'neal
I'm sure there are many I missed but the point is:
Trading knowledge is passed down from one generation to the next. But it is up to us, the trader, to implement what we have learned in a safe manner while we put together all the pieces for ourself.
We live in a time where you DO NOT need to make up some magical elixir for trading in order to be successful.
All the people mentioned above have found an exploitable edge in the market, and like myself relentlessly execute that edge over and over.
I am personally grateful for all of the educators I've had along my journey; which is part of the reason I so willingly share any bit of knowledge I acquire along the way. The same way they all graciously imparted knowledge on me.
@anandragn With vibe coding it is exciting to build apps. I just created a web app to track earnings reaction, gap up/gap down and performance since earnings date. The idea is to focus earnings play and develop automated alert system for stocks that had strong earnings reaction.
A Quick Deep Dive on Parabolic Tops and How to Avoid Getting Trapped Following a Climax:
Long thread FYI, but I see accounts on here every day who fall in love with these stocks that have already topped out and buy them the whole way down, misleading their followers. Sadly reality is, those posts will probably receive more engagement than this one. Personally think this is extremely valuable and encourage to read through/share.
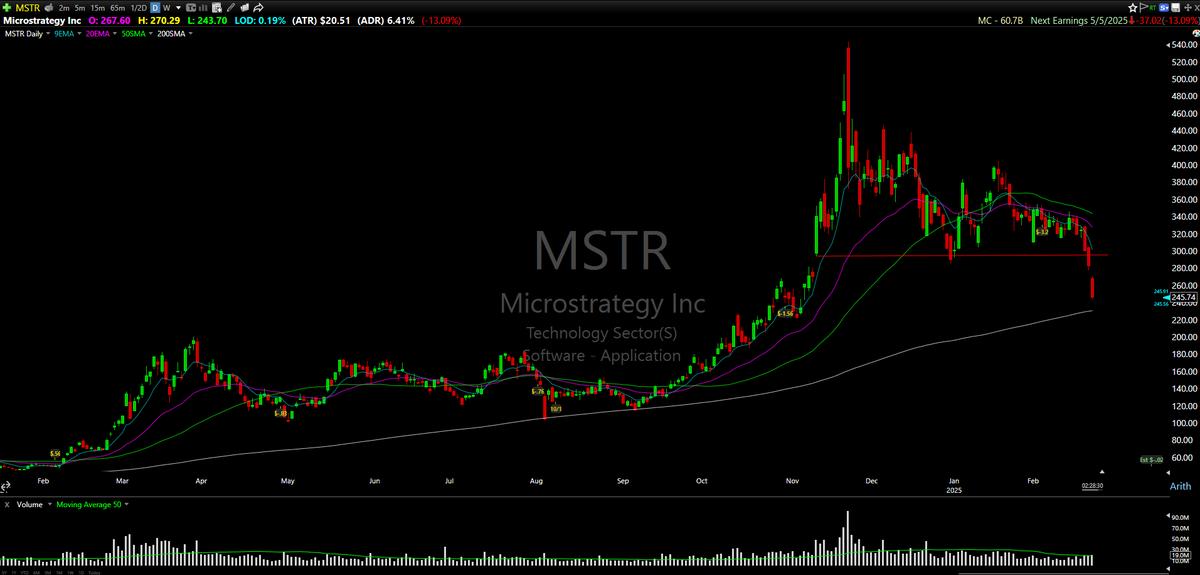
I originally posted $MSTR as a parabolic short opportunity at 7:34am on November 21st, which happed to be the day it blew off and has not touched that high again since.
It opened that day at $535.60 and fell -31.5% in just a few hours, closing at $397.28. It also traded its highest daily volume ever that day, trading over 100,000,000 shares.
I have spent hundreds of hours studying parabolic tops, even some 20+ years ago. Nothing new happens in the stock market, same patterns and cycles over and over again for over 100 years, just different tickers and different players. The only way to understand how these setups work is by going back through history and studying.
What I wanted to discuss today is specifically retail favorite, cult like stocks that make parabolic moves and climax at the highs. Will post and dissect a few examples below.
A parabolic cycle top will often be preceded by a multi week/month run, with percentage gains anywhere between 100-3000%. These moves often accelerate and steepen the higher they go, with very few pullbacks or consolidation periods.
In some occasions, you will see a name go parabolic very suddenly and move multiple hundreds of percent in just a few days. These usually give back more than 50% of the move rather quickly. Stuff like $TIGR from October 2024 for example. This is not the type of moves I am discussing today.
The longer the run up into the parabolic top, the more likely they are to stick around and trade in range for a while before eventually breaking down lower.
If I could give one helpful piece of advice, it is to never, ever marry a stock. Simply view them as trading/investment vehicles. Even some of the safest and greatest stocks in history have experienced drawdowns of -70% or more at some point.
Going to review a few examples and discuss the striking similarities between all of these at the end. The psychology and structure of the charts are all the same, just different tickers. I even included an example from 2001, to prove that these are the same setups over and over again.
Example 1: $MSTR
MicroStrategy saw a massive run up of +300% in just 2 months. The stock went from $160 to $550. This very quickly became a retail favorite stock amidst the euphoria in crypto. The last 3 days before its blow off, the stock had completely detached itself from Bitcoin and put what I call a parabolic burst. It's leveraged ETF's $MSTX and $MSTU were the third and fourth most actively traded ETF's in the entire market on 11/20, just behind $SPY $QQQ and $IWM. This move was simply unsustainable. Following the blow off top, the stock then consolidated for about 3-months before recently breaking down below its stage 3 topping pattern. It is now down over -55% from its parabolic top and majority of buyers completely underwater.
Example 2: $SMCI
Super Micro Computer was actually one of the strongest stocks during the 2022 bear market, closing that year up +86%. On 1/19/24 it broke out of a 5-month base on pre-announced earnings. This was also shortly after $NVDA and $SMH exploded higher. Clearly participants taking advantage of the Semiconductor bull market. $SMCI quickly turned parabolic, making a +250% move with little to no consolidation on the way higher. Similar to $MSTR's run up, this was not sustainable. It put in its parabolic top on February 16th, falling -25% from highs in a single session. A week or two later it briefly made news highs on news that it got the Nasdaq inclusion, but that did not last long. This was the biggest retail favorite at the time and quickly became a overcrowded trade. It proceeded to base out in a range for 4 months before breaking down into a stage 4 downtrend. At one point, it was down -85% from its highs only 8 months later.
Example 3: $AMC
I'm guessing I don't need to speak much on this one. Probably the most loved retail stock of all time. This name developed a cult like no other. $AMC saw a massive +2,500% rise during the meme stock craze of 2021. The day after it topped, it fell -50% in a single session. Following that parabolic top, it then traded in a wide, sloppy range for 6 months. Eventually, in December 2021 it broke down through the bottom of this base and in no time was down -90% from its climax high in June.
Example 4: $QCOM
Throughout the dot com bubble of 1999-2001, $QCOM was essentially the $SMCI of that run. It made a +3,000% move in just 12 months. In January of 2000, it put in a parabolic top, falling -30% in just two sessions. Based off the examples posted above, can you guess what it did next? Yet again, it traded in a sideways range for 4-months, only to breakdown into a stage 4 downtrend. By July 2000, it was down over -75% from its parabolic top.
Now that we've looked at a few examples of the same exact setup (a parabolic top), some recent and some 5-20 years ago, what are some similarities we find here?
1. All of these stocks built a cult like following. They were the most talked about stocks in the market during their run. Often times, a stock with a cult like following is a MAJOR red flag. These cult followers will buy every single dip on these stocks until they are essentially liquidated. They built some special connection to the stock and could not let it go, despite price moving lower. These people are trying to outsmart the market. Unfortunately, only price pays, not opinions. Nothing more dangerous than a fool who things they are a genius.
2. They all put in a massive short term reversal off the highs, often accompanied by the the highest volume of the entire run. These types of blow off moves at the highs come with major repercussions. The stock simply went so high so fast, that there is an overwhelming imbalance between buyers and sellers. It will take MINIMUM a few months for the stock to base out again to attempt another move higher, but a large majority of them end up failing.
3. These moves typically occur in one stock that is part of a larger theme in the market. For example:
$MSTR - Crypto run of Nov-Dec 2024
$SMCI - Semi run of January 2024
$AMC - Meme stock run of May-June 2021
$QCOM - Dot Com Tech Bubble of 1999-2001
4. (This is the most important one, as the point I am trying to get across is preventing yourself from getting trapped in these stocks following their parabolic tops). In every example I provided, the most common characteristic is a faulty 3-6 month base following the blow off move. The stocks will usually trade in a very wide and loose base with many vicious rallies and steep declines. The cult followers of the stock and the participants that missed out on the initial run higher will almost always view this base as a buying opportunity and in some cases a "bull flag". Big players use this opportunity to sell into pops and FOMO buyers, causing what is called "Re-distribution". Eventually, the selling pressure becomes too strong and there are not enough buyers left. This results in the stage 4 breakdown lower, which usually leads to a steep decline for consecutive months as buyers begin to realize the stock is dead money.
I hope this helped some folks. I find the psychology behind these cycles fascinating and encourage you to go back throughout history and study setups like these to help keep you on the right side of the market. This is a little bit of hindsight, obviously, but I did participate in the upside move on $SMCI and $MSTR, and also caught the parabolic shorts on both of them.
Rather than fall in love with these stocks that already made parabolic moves and climaxed, go find the next one! If history taught us anything, it is that these occur time and time again. It may not be easy, but it is much more productive than trying to buy a name with its best days behind it already. You want to be a buyer up the left side of the chart and a seller on the right side.
Best advice I ever got: think like a VC when looking for tech job.
It led me to joining Rippling ($11B+) before its Series A. It changed my life, so I built a free tool to help others.
We expect that each company listed on Prospect will grow at least 2X over the next 4 years: