We are the Microsoft Visual Studio Debugger team. You can reach us through: Tweets, comments on our blogs, VS Developer Community and at [email protected]
Next week at #MSBuild ⚡
Copilot in Visual Studio: Agents that Debug, Profile & Test
These aren’t just code‑gen bots — they find bugs from runtime behavior, surface perf issues, and build tests to block regressions.
A must‑see for C#, .NET & C++ devs.
👉 https://t.co/N1e1b4GDQg
@wstaelens Sorry you're running into this. Could you please file a feedback ticket with details about the memory usage and your setup? That’ll help us investigate what’s going on and figure out the root cause.
We’d really appreciate it.
In today's Visual Studio Toolbox highlight, Marco shows us how Visual Studio has a new, upgraded, guided workflow within the existing Debugger Agent to help you fix issues.
Check it out: https://t.co/IfnOPl1hjP
Check out the latest Visual Studio Toolbox episode
Watch as @mpeyrotc from the Debugger team explains the Debugger Agent.
Learn how to use the guided workflow to navigate from bug report to verified fix with total precision in runtime.
#VisualStudio2026
https://t.co/jNb3r0Gz9I
@archiecoder Love this 🙌
Getting the agent to reason through the bug with you instead of jumping to conclusions was a big focus for us.
Thanks for trying it out and sharing 🙏
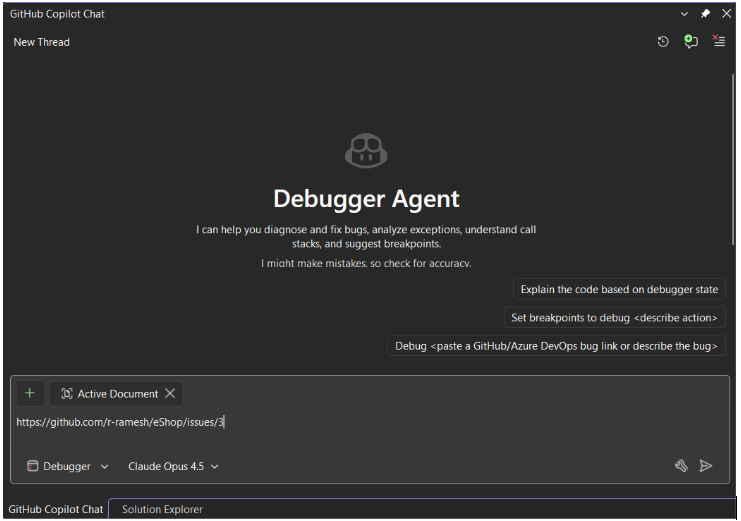
Stop Guessing, Start Fixing!
Meet the new Debugger Agent workflow in Visual Studio. ...not just a chatbot, but a real-time partner that reasons together with you.
https://t.co/MhxBhW3M2D
Working with Copilot for debugging and profiling is now much easier with dedicated agents.
Just select the Debugger or Profiler Agent to get all the context-aware help you need to diagnose and optimize your application instantly.
🤖✨ Visual Studio just got a whole squad of agents — and they’re not your average “chatbot.”
🕵️♀️ Debugger Agent → reads your call stacks + diagnostics like a pro
⚡ Profiler Agent → hunts bottlenecks using real VS profiling data
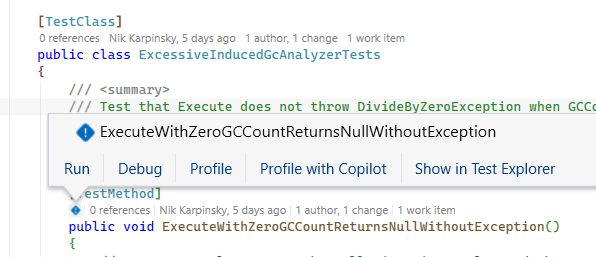
🧪 Test Agent → generates tests that match YOUR project’s patterns
🛠️ Modernize Agent → upgrades .NET/C++ projects with awareness of your graph
And the best part?
🧩 You can build your own custom agents — wired into your repos, docs, APIs, design systems, and more.
Teams are already crafting:
• PR reviewers tied to their style guides
• Design‑system enforcers linked to Figma
• Planning agents that gather requirements before you write a line of code
Dive into how it all works + how to start building your own 👇
https://t.co/A7KCcwLbQU
Got a slow LINQ query?
Now you can catch it and fix it while debugging.
Perf Tips + Profiler Agent in Visual Studio surface real runtime data as you step, and GitHub Copilot helps you optimize instantly. Currently supported in C# .NET.
#VS2026 Insiders
A super easy way for me to optimize performance of my .NET application using my existing unit tests, the built-in profiler, and Copilot to tie it all together into a single click of a button.
Coming to Visual Studio 2026 very soon...
@mkristensen@wstaelens Unfortunately, the Text Visualizer doesn't currently support strings with embedded null characters (\0) in the middle it essentially stops rendering at the first one.
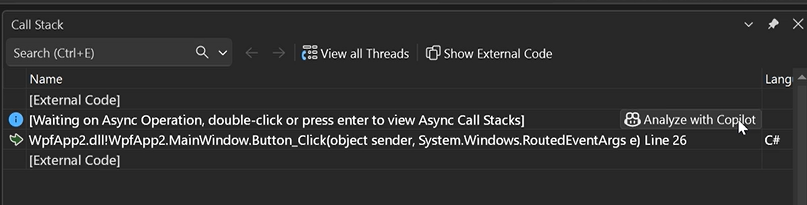
Ever stared at a call stack thinking “okay… but why?”
Analyze Call Stack with Copilot is coming soon bringing instant clarity to sync & async debugging.
Finding the real issue often means tracing deep call chains.
From Live! 360 Orlando, see how GitHub Copilot analyzes context, builds hypotheses, and helps uncover root causes 🧩
Watch to learn more: https://t.co/LXlhqALTdh
📁 Quick Add Files
🖼️ File Explorer Image Optimizer
⌨️ A Keyboard Hero to streamline navigation and improve code quality
In this #VSLive! 360 session replay, we get a wide collection of practical Visual Studio features and workflows that can make everyday development smoother, faster, and more enjoyable. 🎥 https://t.co/vfjPEfcWb8
@mkristensen@johnzabroski@HarshadaHC looks like you have some 3rd-party extensions installed, and we can see inline variables coming from it. We suspect this may be specific to your setup, as we haven’t received any other reports of this issue.
Could you please file a feedback ticket so we can take a closer look?
@Sam75614812@mkristensen The profiler agent can help here too. Even if you don’t know anything about benchmarking, that’s completely fine. It can automatically add a new benchmark suite and generate benchmarks for you if your project doesn’t already have them.
See this example
https://t.co/qJEdjIHUnk
Debugging, minus the drama.
In #VisualStudio2026, #Copilot helps with exception insights from your repo, honest inline values, and condition analysis that shows exactly what failed—so you move faster when tests flake.
Get details, real examples, and quick walkthroughs: https://t.co/qDHdWZYrIq
Debug smarter with GitHub Copilot in Visual Studio! Learn AI-powered breakpoints & deadlock detection in this Live360 session: https://t.co/nJE02a6puH #VisualStudio