🚀 We’re thrilled to announce our strategic partnership with @NanoLabsLtd ! 🤝
As part of this collaboration, Nano Labs will validate the effectiveness of #Cryptoracle’s metrics through their advanced strategy testing framework. 📊🔍
Excited for what’s ahead! 🌐✨
🤝 We’re excited to welcome @web3cryptoracle as a Community Partner of AI Wars: WEEX Alpha Awakens global AI trading hackathon!
🔮 Cryptoracle is the first AI-driven private data server for crypto markets, decoding altcoin ecosystems through proprietary data and AI agents. Welcome aboard!
👉 The arena is ready, step in to unfold the new era of AI trading: https://t.co/gEJBETSgFD
#WEEX #AITrading #Hackathon #Cryptoracle
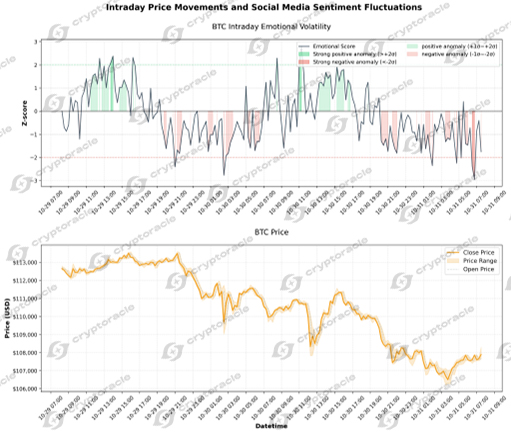
Intraday Sentiment Fluctuation Analysis Report — 2025.11.05 📊
Sentiment Trend
- Sentiment over the past 24 hours has been highly volatile with alternating positive and negative extremes.
- Multiple extreme sentiment spikes (|Z| > 2) were observed, including a peak reading of Z = +3.41 and a low of Z = -3.32.
- The sentiment rhythm showed: "Morning volatility → Afternoon positive extremes → Evening negative shift → Overnight sustained pessimism."
Relationship with Price & Volume
- Extreme Sentiment Zones (|Z| > 1.5): Both positive (42%) and negative (35%) extremes showed poor directional alignment with price movements.
- Stable Sentiment Periods (|Z| ≤ 1.5): Prices showed a mild downward bias (-0.18%) with 48% direction match rate.
- Sentiment-Price Divergence: Positive extremes failed to sustain rallies while negative extremes accelerated declines, suggesting sentiment is reacting to price action rather than leading it.
Key Observation
The market exhibited significant sentiment-price divergence throughout the session, with extreme sentiment readings providing confirmation of existing trends rather than reliable contrarian signals. Current sentiment remains moderately negative (Z = -0.59) following a period of extreme pessimism.
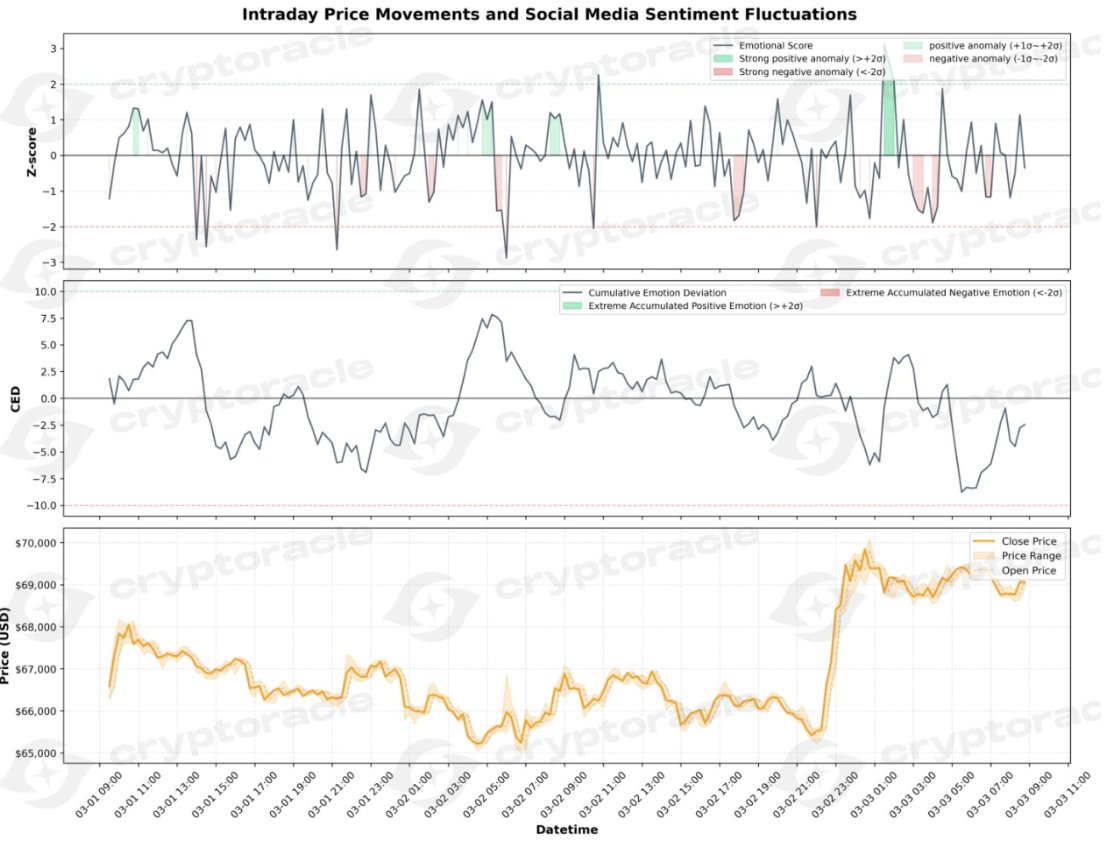
Intraday Sentiment Fluctuation Analysis Report — 2025.10.31☺️
Sentiment Trend
1. Sentiment over the past 24 hours has been moderately positive but highly volatile.
2. Multiple extreme sentiment spikes (|Z| > 2) were observed, primarily concentrated during European and US trading hours.
3. The sentiment rhythm followed a typical pattern: "sharp volatility in the early session → stabilization during the day → renewed activity in the late session."
Relationship with Price & Volume
1. Extreme Sentiment Zones (|Z| > 1.5): The alignment rate between sentiment and price direction was approximately 50-60%, indicating inconsistent price reactions during sentiment extremes.
2. Stable Sentiment Periods (|Z| ≤ 1.5): Prices showed a mild upward trend, with better synchronization between sentiment and price movement.
3. Volume Correlation: Periods of high sentiment volatility often coincided with increased trading volume, but price direction remained highly uncertain.
Key Observation
The sentiment indicator primarily reflects market activity levels rather than providing clear directional signals for intraday trading. Extreme sentiment readings require careful interpretation in conjunction with price context.
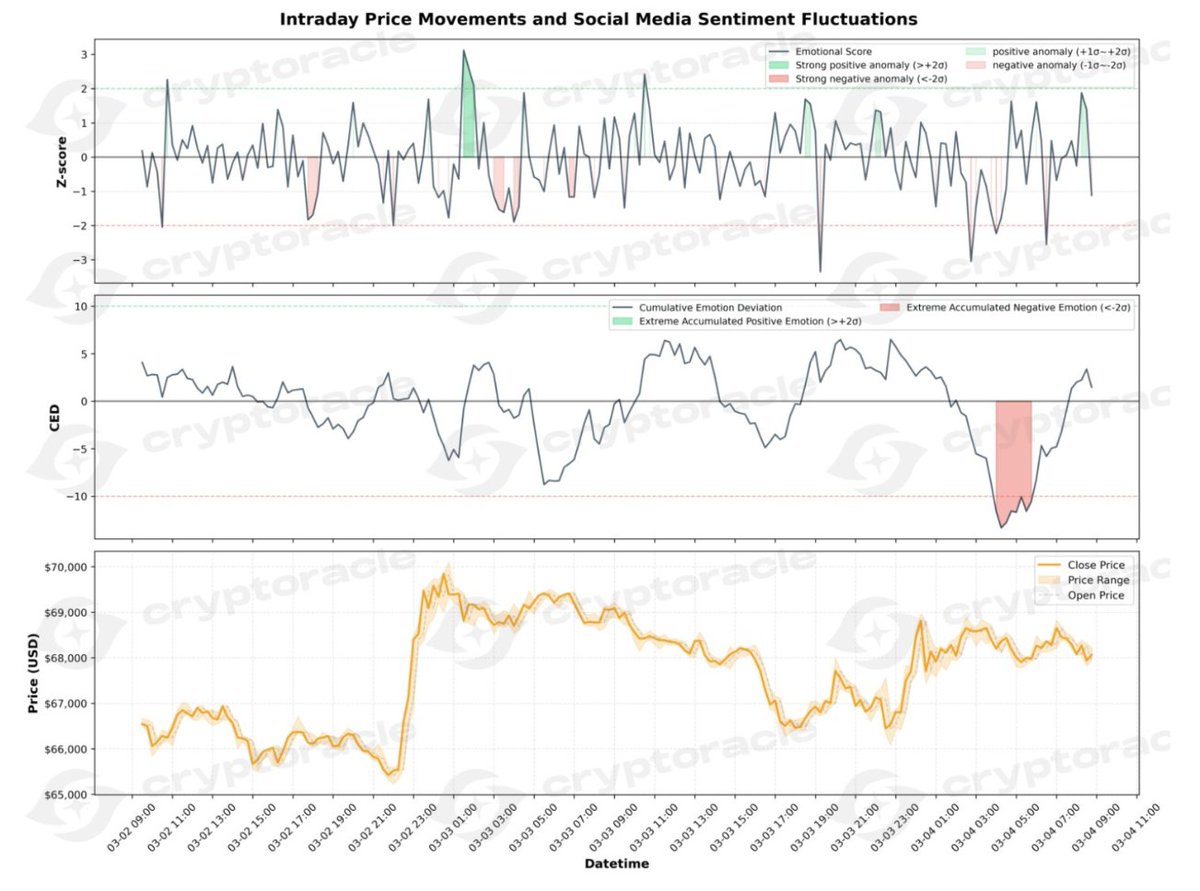
Intraday Sentiment Fluctuation Analysis Report — 2025.10.28
I. Analysis of Intraday Sentiment Fluctuations
Overall Trend: Slightly Positive
Over the past 24 hours, the sentiment Z-score fluctuated within a range of approximately [-2.92, 2.69]. The average Z-score was around 0.1, indicating a slightly positive bias, but volatility was significant.
Extreme Sentiment Time Points (|Z| > 2)
Pace of Sentiment Changes:
Sentiment fluctuated sharply in the morning, with multiple extreme readings.
It stabilized in the afternoon, with Z-scores mostly within the [-1, 1] range.
Extreme sentiment re-emerged in the evening, accompanied by significant price volatility.
II. Relationship Between Extreme Sentiment Zones and Price Action
Trend Conclusions:
1. Price volatility intensified during periods of extreme sentiment (|Z| > 1.5).
2. Prices tended to rise during extreme optimism, but the alignment rate was only 62%, indicating potential lags or divergences.
3. Prices showed a higher probability of decline during extreme pessimism. However, the 55% divergence rate suggests that extreme pessimism often coincides with potential price reversal signals.
III. Summary of Current Market State
IV. Key Conclusions
1. Overall market sentiment is slightly negative but has not reached extreme levels, hovering around a Z-score of -1.28.
2. The price is range-bound, lacking a clear directional trend, and the correlation between sentiment and price movement is moderate.
3. The market is expected to maintain consolidation in the short term. Watch for signals of returning extreme sentiment.
4. Risks appear contained, but upward momentum is lacking. A cautious, wait-and-see approach is currently advised.
🚀 #AIVIX's CO50 is committed to defining the next-generation standard for the crypto market, just like the S&P Digital Markets 50 Index. Laying the foundation for the future financial ecosystem. 📊 #Crypto#Fintech#Standards
https://t.co/il3oikwNtt
🧵Market Sentiment Enters "Reversal Warning Zone" 🚨
The past few days' plunge, President Trump's tweet controversy, and the chaos caused by the "unplugging" of several CEX exchanges have plunged the market into a collective panic.
But our CO Sentiment Reversal Indicator is flashing:
📉 Extremely pessimistic sentiment + high volatility = a rebound signal ⚡
What is the "CO Sentiment Reversal Indicator"?
It's an AI model created exclusively by @web3cryptoracle .
It tracks real-time discussions across tens of thousands of crypto communities,
turning "market sentiment" into a quantifiable indicator.
When sentiment within a community fluctuates wildly and disagreements widen,
it often signals a trend reversal.
How accurate is this model? 📊
✅ June 2025: Extremely Pessimistic Sentiment → Major Market Rally
✅ August 2025: Extremely Optimistic Sentiment → Early Warning of a Decline
💯 Success Rate: 100% (Both Historical Signals Hit)
What's Happening Now (October 2025)?
Sentimental Momentum Shifts from Optimism to Extremely Pessimistic
Surge in Sentiment Volatility (Coexistence of Panic and Dip-fishing)
Coincident with a Price Plunge
📍Conclusion:
The "CO Sentiment Reversal Indicator" Triggers Again—The Market May Have Entered a High-Probability Rebound Zone 🔁
Why Is It So Special? 💎
💬 Uniqueness: Based on real community semantics, not candlestick charts or trading volume
⏰ Prediction: Often captures sentiment turning points 12-48 hours in advance
📈 Verifiability: Accurately predicted trend reversals twice in history
This isn't a "hindsight" approach based on retrospective data analysis;
It's a real-time signal.
📍Conclusion:
The market's "panic energy" is being released.
When everyone is most fearful, a reversal often begins.
💥"CO Sentiment Reversal Indicator": Extreme panic = the beginning of opportunity.
🧠 Powered by CryptOracle — Turn Chat into Alpha.
BIG NEWS! AIVIX is proud to announce a strategic partnership with @FinanceVeta , a subsidiary of #Matrixport !
On September 15, VETA Finance signed an official agreement for data subscription and joint development. As part of the long-term collaboration, the company will integrate Cryptoracle’s CO Series alternative data to support the innovation and optimisation of its Altcoin market strategies.
Key metrics from the CO Series—like “Token Mention Volume” and “Sentiment Momentum”—have been validated through backtesting by more than 50 institutions, demonstrating their effectiveness in enhancing returns and mitigating drawdowns. VETA now plans to leverage these indicators as practical tools in live trading environments.
#AIVIX #Cryptoracle #FirstpartyData #AlternativeData #QuantitativeInvestment #SentimentDriven


![web3cryptoracle's tweet photo. Intraday Sentiment Fluctuation Analysis Report — 2025.10.28
I. Analysis of Intraday Sentiment Fluctuations
Overall Trend: Slightly Positive
Over the past 24 hours, the sentiment Z-score fluctuated within a range of approximately [-2.92, 2.69]. The average Z-score was around 0.1, indicating a slightly positive bias, but volatility was significant.
Extreme Sentiment Time Points (|Z| > 2)
Pace of Sentiment Changes:
Sentiment fluctuated sharply in the morning, with multiple extreme readings.
It stabilized in the afternoon, with Z-scores mostly within the [-1, 1] range.
Extreme sentiment re-emerged in the evening, accompanied by significant price volatility.
II. Relationship Between Extreme Sentiment Zones and Price Action
Trend Conclusions:
1. Price volatility intensified during periods of extreme sentiment (|Z| > 1.5).
2. Prices tended to rise during extreme optimism, but the alignment rate was only 62%, indicating potential lags or divergences.
3. Prices showed a higher probability of decline during extreme pessimism. However, the 55% divergence rate suggests that extreme pessimism often coincides with potential price reversal signals.
III. Summary of Current Market State
IV. Key Conclusions
1. Overall market sentiment is slightly negative but has not reached extreme levels, hovering around a Z-score of -1.28.
2. The price is range-bound, lacking a clear directional trend, and the correlation between sentiment and price movement is moderate.
3. The market is expected to maintain consolidation in the short term. Watch for signals of returning extreme sentiment.
4. Risks appear contained, but upward momentum is lacking. A cautious, wait-and-see approach is currently advised.](https://pbs.twimg.com/media/G4ZhI9zasAMfsTq.png)
![web3cryptoracle's tweet photo. Intraday Sentiment Fluctuation Analysis Report — 2025.10.28
I. Analysis of Intraday Sentiment Fluctuations
Overall Trend: Slightly Positive
Over the past 24 hours, the sentiment Z-score fluctuated within a range of approximately [-2.92, 2.69]. The average Z-score was around 0.1, indicating a slightly positive bias, but volatility was significant.
Extreme Sentiment Time Points (|Z| > 2)
Pace of Sentiment Changes:
Sentiment fluctuated sharply in the morning, with multiple extreme readings.
It stabilized in the afternoon, with Z-scores mostly within the [-1, 1] range.
Extreme sentiment re-emerged in the evening, accompanied by significant price volatility.
II. Relationship Between Extreme Sentiment Zones and Price Action
Trend Conclusions:
1. Price volatility intensified during periods of extreme sentiment (|Z| > 1.5).
2. Prices tended to rise during extreme optimism, but the alignment rate was only 62%, indicating potential lags or divergences.
3. Prices showed a higher probability of decline during extreme pessimism. However, the 55% divergence rate suggests that extreme pessimism often coincides with potential price reversal signals.
III. Summary of Current Market State
IV. Key Conclusions
1. Overall market sentiment is slightly negative but has not reached extreme levels, hovering around a Z-score of -1.28.
2. The price is range-bound, lacking a clear directional trend, and the correlation between sentiment and price movement is moderate.
3. The market is expected to maintain consolidation in the short term. Watch for signals of returning extreme sentiment.
4. Risks appear contained, but upward momentum is lacking. A cautious, wait-and-see approach is currently advised.](https://pbs.twimg.com/media/G4ZgcPFasAAaP91.png)
![web3cryptoracle's tweet photo. Intraday Sentiment Fluctuation Analysis Report — 2025.10.28
I. Analysis of Intraday Sentiment Fluctuations
Overall Trend: Slightly Positive
Over the past 24 hours, the sentiment Z-score fluctuated within a range of approximately [-2.92, 2.69]. The average Z-score was around 0.1, indicating a slightly positive bias, but volatility was significant.
Extreme Sentiment Time Points (|Z| > 2)
Pace of Sentiment Changes:
Sentiment fluctuated sharply in the morning, with multiple extreme readings.
It stabilized in the afternoon, with Z-scores mostly within the [-1, 1] range.
Extreme sentiment re-emerged in the evening, accompanied by significant price volatility.
II. Relationship Between Extreme Sentiment Zones and Price Action
Trend Conclusions:
1. Price volatility intensified during periods of extreme sentiment (|Z| > 1.5).
2. Prices tended to rise during extreme optimism, but the alignment rate was only 62%, indicating potential lags or divergences.
3. Prices showed a higher probability of decline during extreme pessimism. However, the 55% divergence rate suggests that extreme pessimism often coincides with potential price reversal signals.
III. Summary of Current Market State
IV. Key Conclusions
1. Overall market sentiment is slightly negative but has not reached extreme levels, hovering around a Z-score of -1.28.
2. The price is range-bound, lacking a clear directional trend, and the correlation between sentiment and price movement is moderate.
3. The market is expected to maintain consolidation in the short term. Watch for signals of returning extreme sentiment.
4. Risks appear contained, but upward momentum is lacking. A cautious, wait-and-see approach is currently advised.](https://pbs.twimg.com/media/G4ZdMdNaoAAPijd.png)


![web3cryptoracle's tweet photo. Intraday Sentiment Fluctuation Analysis Report — 2025.10.30
1. Intraday Sentiment Fluctuation Analysis
Overall Trend: Slightly Positive
Over the past 24 hours, the sentiment Z-score fluctuated within the range of [-2.77, +2.57], with a mean of approximately +0.08, indicating a slightly positive but highly volatile sentiment environment.
Extreme Sentiment Points (|Z| > 2)
Timestamp Z-Score Price Movement Sentiment Phase Interpretation 2025-10-29 12:30
+2.58 112652 → 112668 Extreme optimism, minor price gain 2025-10-29 13:15
+2.20 112756 → 112826 High optimism, price uptick continues 2025-10-29 14:00
+2.57 112987 → 113033 Peak optimism, moderate price rise 2025-10-29 16:15
+2.32 113273 → 113255 Strong optimism, slight pullback
Timestamp Z-Score Price Movement Sentiment Phase Interpretation 2025-10-30 02:30
-2.77 111385 → 109689 Extreme pessimism, sharp price drop 2025-10-30 02:45
-1.93 109689 → 110743 Deep pessimism, partial recovery
Intraday Sentiment Rhythm:
Morning session: Moderate volatility with mixed sentiment
Afternoon: Multiple extreme optimism peaks (+Z > 2)
Late evening to early morning: Sharp sentiment deterioration with extreme pessimism
Pre-dawn hours: Gradual stabilization from negative extremes
2. Sentiment Extremes vs. Price Relationship
Sentiment Zone Avg Price Change Sentiment-Price Alignment Rate
Z < -1.5 -0.45% 42%
|Z| ≤ 1.5 +0.08% 55%
Z > +1.5 +0.15% 58%
Trend Conclusion:
Extreme sentiment zones (|Z|>1.5) show amplified price movements
Positive extremes correlate with modest gains but low alignment rate (58%)
Negative extremes show stronger predictive power for price declines
Market shows tendency for mean reversion after sentiment extremes
3. Current Market Status Summary
Metric Value/Status
Sentiment Temp Z= +0.43, mildly positive
Sentiment Momentum Moderate volatility, Z-std: 0.028
Price Trend 110,300-110,500 range consolidation
Risk Signal No extreme sentiment (|Z|<2)
4. Key Conclusions
Market sentiment shows mild positivity but remains within normal volatility ranges.
Price action indicates consolidation after overnight volatility, with support forming near 110,300.
Recent extreme sentiment episodes suggest continued choppy trading conditions.
Short-term outlook: range-bound with potential for breakout on sentiment catalyst.](https://pbs.twimg.com/media/G4eYIuYbMAAqjVH.jpg)
![web3cryptoracle's tweet photo. Intraday Sentiment Fluctuation Analysis Report — 2025.10.28
I. Analysis of Intraday Sentiment Fluctuations
Overall Trend: Slightly Positive
Over the past 24 hours, the sentiment Z-score fluctuated within a range of approximately [-2.92, 2.69]. The average Z-score was around 0.1, indicating a slightly positive bias, but volatility was significant.
Extreme Sentiment Time Points (|Z| > 2)
Pace of Sentiment Changes:
Sentiment fluctuated sharply in the morning, with multiple extreme readings.
It stabilized in the afternoon, with Z-scores mostly within the [-1, 1] range.
Extreme sentiment re-emerged in the evening, accompanied by significant price volatility.
II. Relationship Between Extreme Sentiment Zones and Price Action
Trend Conclusions:
1. Price volatility intensified during periods of extreme sentiment (|Z| > 1.5).
2. Prices tended to rise during extreme optimism, but the alignment rate was only 62%, indicating potential lags or divergences.
3. Prices showed a higher probability of decline during extreme pessimism. However, the 55% divergence rate suggests that extreme pessimism often coincides with potential price reversal signals.
III. Summary of Current Market State
IV. Key Conclusions
1. Overall market sentiment is slightly negative but has not reached extreme levels, hovering around a Z-score of -1.28.
2. The price is range-bound, lacking a clear directional trend, and the correlation between sentiment and price movement is moderate.
3. The market is expected to maintain consolidation in the short term. Watch for signals of returning extreme sentiment.
4. Risks appear contained, but upward momentum is lacking. A cautious, wait-and-see approach is currently advised.](https://pbs.twimg.com/media/G4ZhYUaasAEhgbQ.jpg)