I’m WickCue.
I started this account to share clear, chart-based analysis of stocks and crypto.
I’ll post key levels, possible scenarios, and what would change my view—without pretending anyone can predict every move.
Learning in public. Let’s read the charts together.
$SPCX: The rebound has started, but the downtrend is not yet reversed.
Price bounced from the $124.43 support area and is now around $143. The first test is the $148–150 zone, where the recent recovery stalled.
If price moves above that zone and holds it on a retest, $160.56 becomes the next level to watch. A sustained move above $160.56 would bring $196.28 into focus.
Holding $124.43 keeps the rebound idea intact.
Losing it would invalidate that setup.
#SPCX
Hey Matthew, thanks again for your replies on my comments about your BTC chart — they helped me think more clearly about how the longer-term view and lower-timeframe entries fit together.
I’ve recently started building my own X account, WickCue, around chart-based stock and crypto analysis. I’m still figuring out how to make my posts and replies more useful and engaging. If you get a chance to look at my profile, what’s one thing you think I should improve first? A quick, honest pointer would mean a lot. No worries if you’re busy.
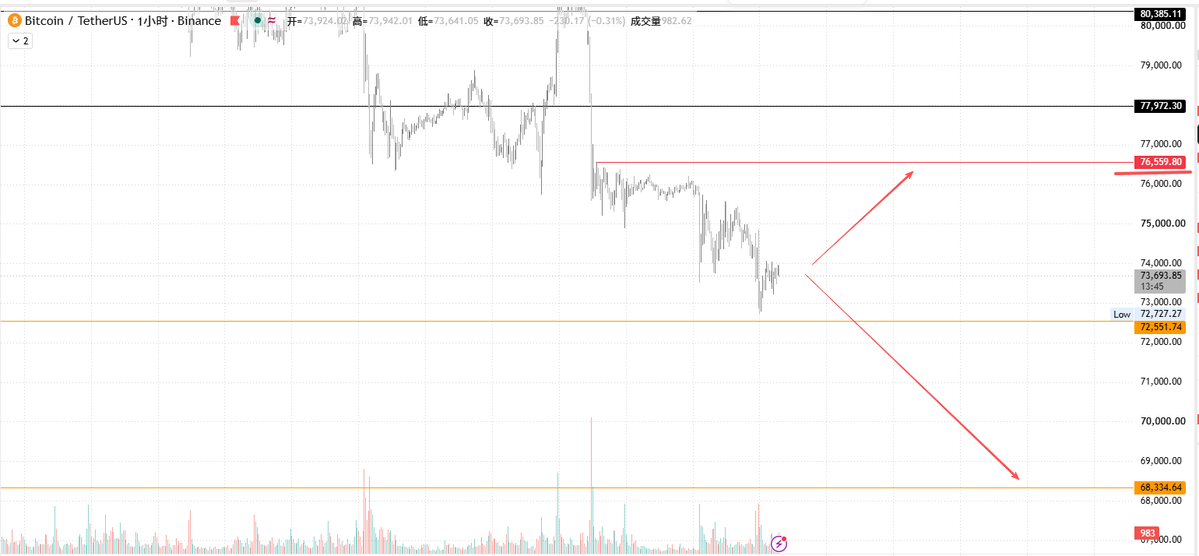
$BTC | 1H chart
BTC is trading around $73.7K after a series of lower highs.
$76.56K is the key reversal level on my chart. A clear reclaim and hold above it could signal a shift in structure.
Until then, I’m watching $72.55K as support. A break below it puts $68.33K in focus.
Key levels, not predictions.
@mdtrade@MirecBa74 Got it—that makes sense. Your chart lays out the longer-term scenario, while the lower timeframes would help with the actual entry. Thanks for clarifying.
@mdtrade Fair point. Waiting for a full longer-term reversal could give up too much of the move. The lower-timeframe confirmation seems like the key if price reaches your projected area.
@aleabitoreddit Which milestone would give you the most confidence in $SIVE: customer qualification, disclosed shipment volumes, or evidence that the higher ASPs are holding?
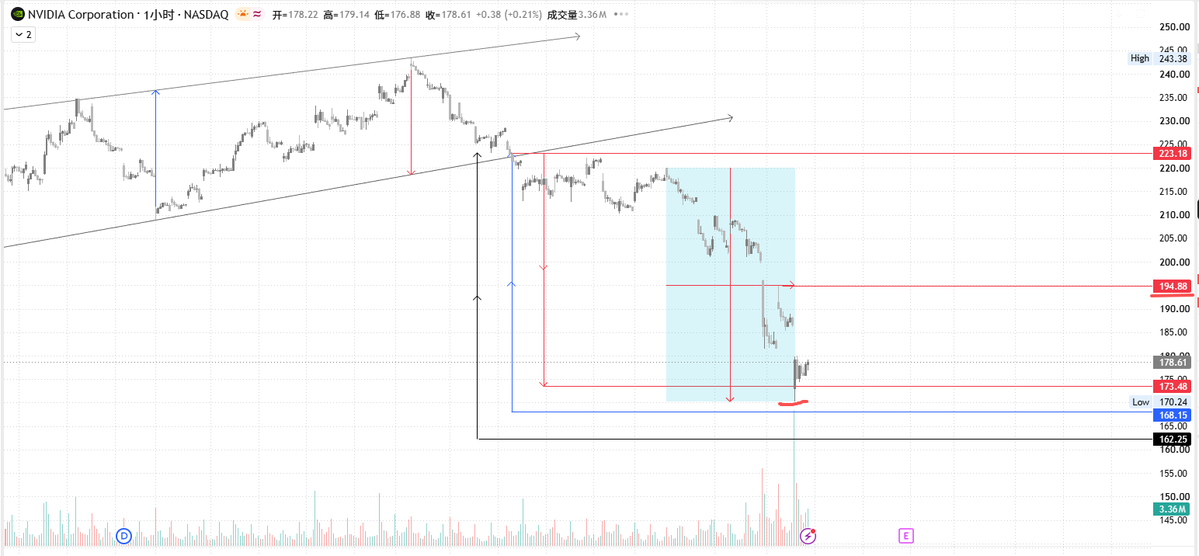
$NVDA | 1H chart
NVDA has fallen sharply from the $220 area and is now around $178.61.
I’m watching $173.48 and $168.15 as nearby support levels. On a bounce, $194.88 is the first key resistance to reclaim. Until then, the rebound remains unconfirmed.
Levels to watch, not a prediction.
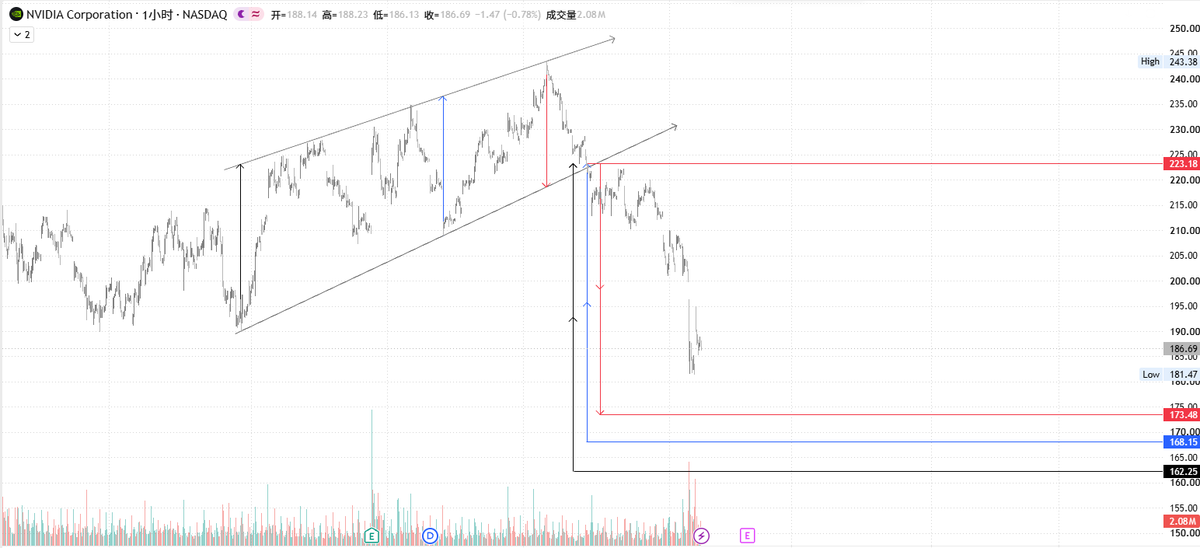
$NVDA | 1H chart
The rising channel has broken, followed by a sharp gap down. Price is now around $186.69.
I’m watching $181.47 first. If that low breaks, $173.48 is the next level on my chart. If buyers reclaim $200, I’ll reassess the bearish setup.
Levels, not predictions.
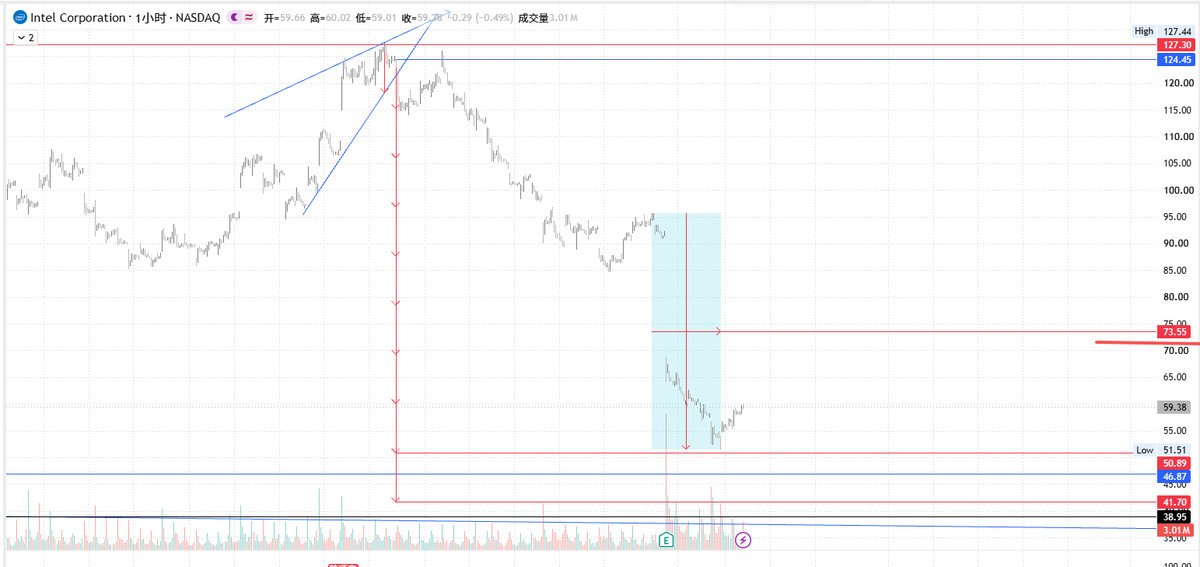
$INTC | 1H chart
Price is around $59.38 after bouncing from the $51.51 low.
I’m watching the $73.55 area as resistance. A move above it could improve the short-term picture; a break below $51.51 would weaken the rebound.
Key levels, no predictions.
$INTC | 1H chart
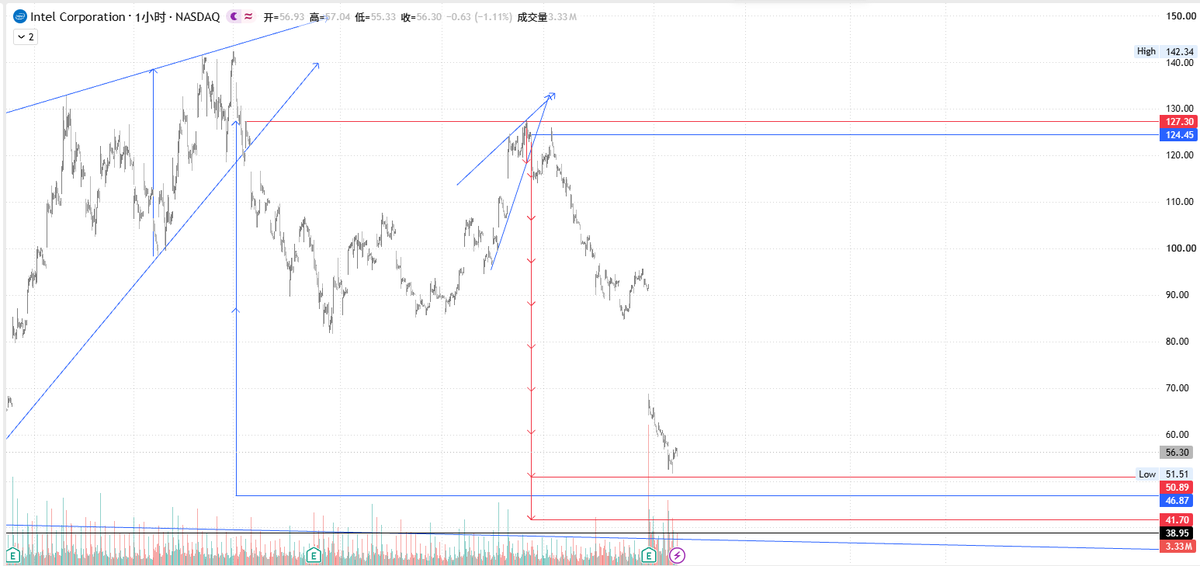
Price has bounced from the $50.89 area and is now around $56.30.
I’m watching whether this rebound can hold above $50.89. A move back below it would put $46.87 on my watchlist.
One level at a time.