@Peter_thoc How could BTC bottomed in Feb when in June it went lower? Technically it bottomed in June so far and there is still no sign of the final bottom.
Bitcoin is the deflationary free market asset that everything is falling in price against.
In dollars, everything looks like it’s getting more expensive because the measuring stick is melting in your hand.
Price the world in Bitcoin, then smooth out the volatility with a 4-year moving average, and the fog clears...
The world's hardest money turns the global economy into a long-running clearance sale.
Since Jan 2016, priced in BTC on a 4-year Moving Average:
Gold: 66.12 BTC → 0.0544 BTC
Down 99.92%
Annualized decay: -49.1%/yr
Silver: 1.224 BTC → 0.000685 BTC
Down 99.94%
Annualized decay: -50.9%/yr
S&P 500 / SPY: 5.716 BTC → 0.0112 BTC
Down 99.80%
Annualized decay: -44.7%/yr
WTI Oil: 3.831 BTC → 0.00184 BTC
Down 99.95%
Annualized decay: -51.7%/yr
This here is the entire Bitcoin thesis in one video.
The dollar chart tells you everything is inflating.
The Bitcoin chart tells you everything is falling in price against perfect scarcity.
Volatility is the admission fee.
Deflation, not inflation, is the destination:
The most bullish Bitcoin chart is the one that keeps grinding higher while everyone stares at the spot price.
The 4-year moving average of realized price is the market's smoothed cost basis.
It is the slow, load-bearing floor under the entire asset, and it is still compounding at nearly 30% a year after a full decade of adoption.
YoY CAGR of the 4Y realized price MA:
2014: $101.47 - baseline
2015: $173.33 - 70.82%
2016: $259.08 - 49.47%
2017: $576.40 - 122.48%
2018: $1,771.46 - 207.33%
2019: $2,954.45 - 66.78%
2020: $4,405.83 - 49.13%
2021: $8,876.68 - 101.48%
2022: $13,246.03 - 49.22%
2023: $17,064.55 - 28.83%
2024: $23,076.40 - 35.23%
2025: $30,521.35 - 32.26%
2026 YTD: $34,345.61 - 29.39%
Read the bottom cluster again.
Four halvings, three "generational" crashes, and roughly 9,000 obituaries later, the smoothed floor still compounds at 30% a year.
The explosive early-cycle numbers cooled off and the metric barely noticed.
Your savings account pays 4%.
The floor under Bitcoin compounds at 30%.
The volatility you keep flinching at is just the entry fee for that seat.
FACT: Bitcoin has BOTTOMED 500 days before EVERY HALVING
And TOPPED 500 days after
3 times in a row without missing, look at the chart
Right now we're sitting inside the bottom window of the 2028 halving cycle
Good news: Bottom is closer than most people think
Bad news: The window closes faster than people expect
The 500/500 rule doesn't tell you the exact price
It tells you the exact moment
Get ready!
Dont forget: I called the $BTC crash from $126k before it happened - publicly, on this page
Every local move since then - mapped out here too
The next update is the most important one this cycle - we're approaching the level where the real bottom forms
Follow now to not miss the update - turn on notifications to see it first
$BTC to $1M Is Not a Moonshot. It Is the Next 10x.
Bitcoin already moved:
$0.10 → $100,000
That is a 1,000,000x move in ~14 years.
Six separate 10x moves.
$0.10 → $1
Oct 2010 → Feb 2011
Step time: ~4 months
Age from genesis: ~2.1 years
$1 → $10
Feb 2011 → Jun 2011
Step time: ~4 months
Age from genesis: ~2.4 years
$10 → $100
Jun 2011 → Apr 2013
Step time: ~22 months
Age from genesis: ~4.3 years
$100 → $1,000
Apr 2013 → Nov 2013
Step time: ~7 months
Age from genesis: ~4.9 years
$1,000 → $10,000
Nov 2013 → Nov 2017
Step time: ~4 years
Age from genesis: ~8.9 years
$10,000 → $100,000
Nov 2017 → Dec 2024
Step time: ~7 years
Age from genesis: ~15.9 years
Every move delivered the same return:
10x.
But every move felt harder to believe.
$10 → $100 felt possible.
$10,000 → $100,000 felt absurd.
Same math.
Different emotion.
The next step is:
$100,000 → $1,000,000
On a linear chart, that looks insane.
On a log chart, it is simply the next order of magnitude.
That is what scale invariance means.
$10 → $100 and $100,000 → $1,000,000 are the same distance on a log chart.
The dollar amounts change.
The scaling relationship does not.
Bitcoin does not care how big the number feels to your brain.
It moves by orders of magnitude.
Now look at the timing.
The last major 10x took about 7 years:
$10K in Nov 2017 → $100K in Dec 2024
If the next 10x takes roughly the same or slightly longer, the next milestone lands around:
$1M BTC in 2032–2035
The power-law points closer to 2032–2033.
Historically consistent with Bitcoin’s long-term monetization path.
At $1M per BTC, Bitcoin would be roughly a $20T asset.
That is approximately gold-scale territory.
The log chart shows the scaling.
$1M Bitcoin is reasonable on the math of scaling.
$BTC (1M) - The signal that marked every Bitcoin bottom.
One of the most reliable signals in Bitcoin's history:
The monthly MFI dropping below 35.
The Money Flow Index measures buying and selling pressure entering the market.
And every cycle tells the same story.
When the monthly MFI dropped below 35,
Bitcoin was either forming or sitting extremely close to its cycle bottom.
✅ 2015
✅ 2018
✅ 2022
Three cycles in a row.
Now we're approaching that level again.
Could this time be different?
Of course.
But if history continues to rhyme,
the biggest opportunities are usually found when the monthly MFI enters this zone.
And if this signal triggers again...
don't ignore it.
These opportunities only come around once every four years.
Bookmark this.
Your future self will thank you.
#Bitcoin
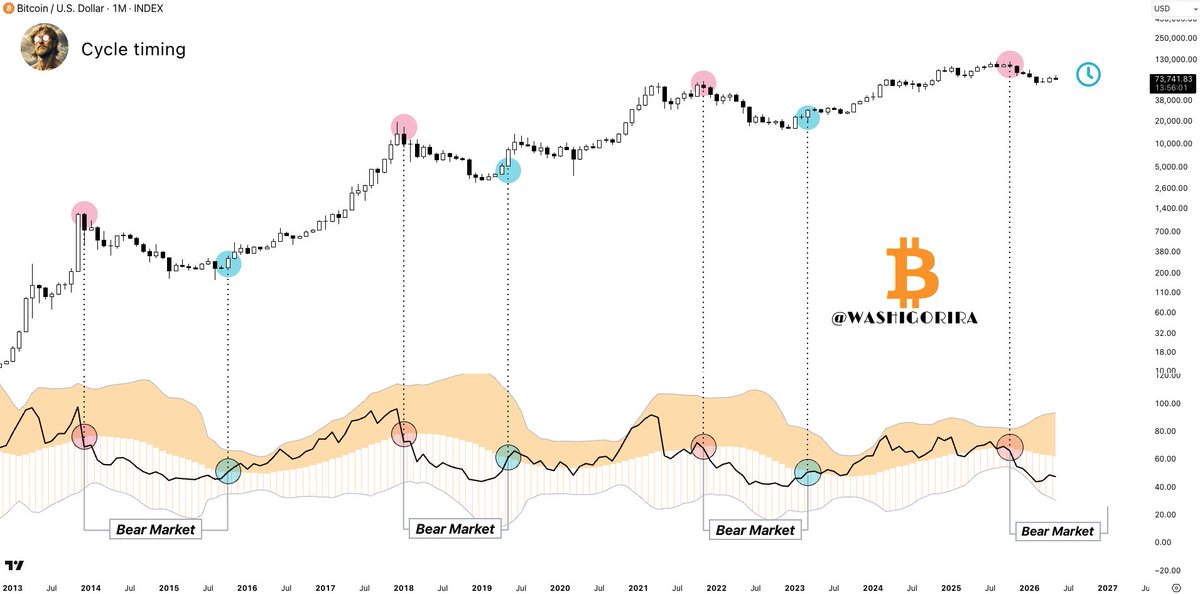
I shared this chart in January 2023 and again in October 2025.
For me, the bear market ends when the black line enters the orange zone.
Until then, I remain cautious.
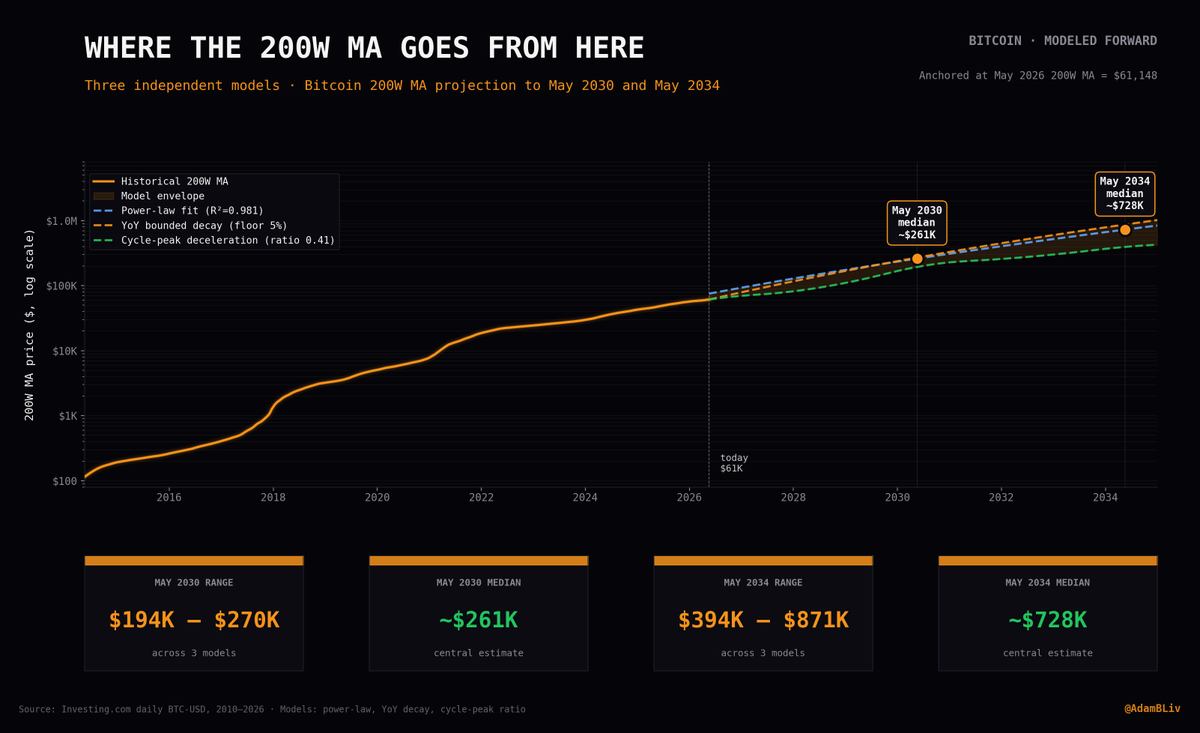
The Bitcoin 200-week MA is the smoothest, most reliable signal in finance.
It has never had a down year in 12 years of measurement.
The question is where it goes from here.
I ran three independent models on 4,386 daily observations of Bitcoin's price.
Different assumptions, different functional forms, different decay mechanisms.
The question I wanted answered: what does this thing look like in May 2030 and May 2034?
MODEL 1 - POWER LAW
Fit log(200W MA) against log(days since genesis):
log(MA) = -41.18 + 5.986 · log(days)
R² = 0.9812.
98% of the variance in the smoothed log price is explained by the log of time.
Twelve years of data, one parameter doing all the work.
The exponent of ~6 tells you the 200W MA grows roughly as the sixth power of time.
Every doubling of Bitcoin's age compounds the smoothed price by 64x, but doublings of age happen less and less often. Deceleration is baked into the math.
May 2030: $260,579
May 2034: $727,704
MODEL 2 - BOUNDED EXPONENTIAL DECAY OF YoY GROWTH
Model the YoY growth rate of the 200W MA, not the MA itself.
Fit: YoY(t) = 5% + 122% · exp(-0.080 · t)
Long-run floor: 5%. Half-life of excess growth: 8.7 years.
In ten years YoY lands at 26%. In twenty years, 14%.
Floored at 5% because the 200W MA has never had a YoY reading below +19% in any observation, so asymptoting to anything lower is statistically unsupported.
Compound that decaying YoY day-by-day forward:
May 2030: $269,940
May 2034: $870,654
MODEL 3 - CYCLE-PEAK DECELERATION RATIO
Run peak detection on the daily YoY series. Two cycle peaks emerge:
May 2018: YoY +345%
Dec 2021: YoY +143%
Decay ratio: 0.414.
Each cycle's peak compounds at ~41% of the prior cycle's peak... the halving structure expressed in returns space.
Project forward with the same ratio and the cycle-aware structure (peaks ~18 months post-halving, troughs ~36 months post-halving):
Next peak Oct 2029: YoY +59%
Peak after Oct 2033: YoY +25%
Some critical honesty here... this model has exactly ONE observed decay ratio, so it carries the most uncertainty.
But the geometric structure is consistent with the power-law slowdown, and it gives a third independent perspective.
May 2030: $193,840
May 2034: $393,950
Median across three models:
May 2030 200W MA: ~$261K
May 2034 200W MA: ~$728K
Models 1 and 2 land within 4% of each other for May 2030.
Model 3 is meaningfully lower because the target dates fall on the down-leg of the next cycle.
The range spans $194K to $270K for May 2030, $394K to $871K for May 2034.
What does this mean for the spot price of Bitcoin?
The MA is the gravity line. Spot oscillates around it.
Across full cycles, spot has traded 0.65x to 2.5x the 200W MA. Both target dates fall ~7 months after projected cycle peaks, putting expected spot in the 0.8x to 1.4x range.
May 2030 spot band: $183K (drawdown) to $521K (peak zone)
May 2034 spot band: $510K (drawdown) to $1.46M (peak zone)
The Bitcoin bears need the 200W MA to do something it has never done: print red.
Hyperbulls calling for $2M by 2030 need the YoY decay to reverse, which has never happened cycle-over-cycle in any observation.
The honest base case sits between those extremes.
The 200W MA goes to ~$260K by May 2030 and ~$730K by May 2034.
Spot tracks somewhere between 0.7x and 2.0x that line depending on where you sit in the cycle.
Million dollar Bitcoin by 2034 isn't a moonshot at all.
At a normal cycle multiple, it's the central forecast.
Buy the floor. Hold the line. Compound.
Bitcoin's 200-week moving average has never posted a negative year.
Not in 2018. Not in 2022. Not now.
Year-end YoY growth of the 200WMA:
2015: +36.0%
2016: +55.6%
2017: +234.8%
2018: +136.2%
2019: +57.3%
2020: +54.0%
2021: +139.6%
2022: +30.6%
2023: +22.0%
2024: +43.6%
2025: +33.0%
2026 YTD: +7.5%
The spot price terrifies you.
The floor compounds anyway.
Twelve consecutive years of a rising floor in the most volatile asset on earth.
This is what monetization looks like in real time.
@Sykodelic_ I'm here to tell you that every man on earth and their dog said the same thing about the top in 2025 Q4.
That because everybody is waiting for the top in that timeframe it won't come for sure. It arrived like clockwork. Just like the low will come in Q4 this year. Like clockwork
@BigpictureBTC You can argue that the idea of selling BTC is an ability to change course and adapt. Nothing is written in stone. That are doing what is the best interests of shareholders and if they are achieving that with selling a small portion of BTC for a bigger win overall let is be
@ccfxstudios He first bought BTC with his company's money in 2020 August when bitcoin was $11k then again in September for $10k.
Please first do some research before you make a false statement.
@iambroots Everyone was saying that 2025 Q4 is the top 1-2 years earlier and IT WAS!
Also when you are saying "maybe 10% lower" than that means the bottom is not it! 😀
@PunterJeff BTC is in a downtrend and very likely 70-80% chance it's going lower in the coming month. So there is only 1-2% chance or even less it will reach your mentioned number at the end of 2026
@PLSValidator All the HEX whales and sharks should do this and pivot to the faster horse. It's a no brainer.
There is still some time left before the new all time high.
$HEX #HEX#PLS