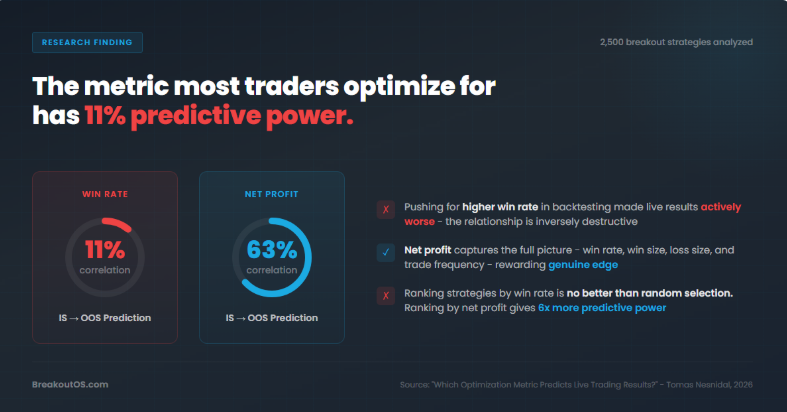
I ran a correlation analysis across 2,500 breakout strategies.
The goal: find which optimization metric actually predicts live trading results.
Win percentage: 0.11 correlation between backtest and live performance.
That is 11%. Statistically indistinguishable from random.
The regression line was almost perfectly flat. A strategy showing 80% win rate in-sample was no more likely to maintain that win rate live than one showing 50%.
Net profit: 0.63 correlation.
Clear upward slope. Strategies with higher in-sample net profit consistently produced higher out-of-sample net profit.
That gap, 11% vs. 63%, is not a minor finding. It is the difference between picking strategies at random and actually working with data that has predictive power.
Here is the part that should concern every trader who has spent time polishing a backtest win rate:
When I used a slider to push the minimum win percentage threshold progressively higher across those 2,500 strategies, the average out-of-sample win percentage went down.
Not flat. Down.
The harder you optimize for win rate in backtesting, the worse your live results become on average.
The mechanism is filter accumulation.
> You build a strategy showing 60% win rate.
> You decide that is not good enough.
> You add filters and re-optimize parameters until the backtest shows 80%.
> The equity curve looks excellent.
> You go live. The strategy immediately loses money.
Every filter and parameter adjustment made the strategy more specific to the historical data it was built on. It did not find a better edge. It memorized noise.
The losing trades that got filtered out were random. They will not repeat in the same pattern. But the strategy was built as if they would.
Why does net profit hold up where win percentage collapses?
Net profit is holistic. It captures win rate, average win size, average loss size, and trade frequency simultaneously. You cannot inflate it by adding complexity that eliminates random losers, because those losers still contributed to the overall profit picture.
Win percentage is single-dimensional. It measures one thing and can be pushed arbitrarily high through overfitting without any real edge being created.
The full correlation ranking across metrics tested:
> Net profit: 0.63 (strong, clear upward regression)
> Net profit to drawdown ratio: moderate-high
> Profit factor: moderate
> Sharpe ratio: moderate
> Win percentage: 0.11 (essentially flat, no predictive value)
Practical workflow based on this data:
> Generate a large pool of strategies (hundreds or thousands)
> Rank by in-sample net profit as your primary fitness function
> Apply secondary filters: max drawdown limits, minimum trade count, profit factor floors
> Validate top candidates on out-of-sample data
> Never select based on win percentage alone
If you are ranking 500 strategies by win rate to pick the best 10 for live trading, the data says you are picking at random.
If you rank by net profit, the 63% correlation means you have statistical ground to stand on.
2,500 strategies. One number that changed how we select at the hedge fund: 0.11 vs. 0.63.