How did I handle the recent pullback in U.S. stocks?
Did I sell the top?
🙅🏻♂️ No.
Did I hedge perfectly before the market turned?
🙅🏻♂️ No.
Did I rush to short the market?
🙅🏻♂️ No.
In my June 7 JLA Weekly Reports, right after the market had pulled back sharply, I wrote:
“This pullback looks more like mean reversion after a strong advance, rather than a confirmed major top, crash, or bear market.”
Not because I had a crystal ball 🔮
But because the evidence at the time did not support a broad market breakdown.
$QQQ had pulled back hard. Semiconductors and AI hardware names were under pressure. Many extended stocks saw sharp profit-taking.
But the bigger picture was still intact.
$RSP was not collapsing.
Market breadth had not broken down aggressively.
The Net High / Low Ratio was still holding up.
The QQQ weekly chart still looked like a normal pullback after a strong advance.
So my base case was clear:
This was more likely a reset than the start of a crash. 🔄
A few days later, the market found a low after a 6-day pullback and repaired most of the damage, moving back close to new highs.
But the real lesson is not “I was right.”
The real lesson is this:
When the market pulls back sharply, you need a framework to separate a normal reset from a true character change.
That is also why I did not rush to short the market.
Shorting a pullback inside a strong uptrend is extremely difficult.
When your focus is on the short side, you can easily miss the bigger opportunity:
Preparing for the next group of leaders.
Even worse, you may lose your winning positions during the process — and when the market recovers, you are forced to buy them back at higher prices.
Most traders never do.
Because human nature makes it very difficult to sell low and buy back higher.
Your mind says: “I’ll wait for another pullback.”
Your ego says: “I don’t want to chase.”
And your finger simply cannot press the buy button.
That is how traders lose their best positions and miss the next group of leaders. 🎯
In strong markets, sharp pullbacks are not always bearish.
Sometimes they are necessary.
They shake out weak hands, reset sentiment, and reveal where institutional demand still exists.
That is why, after a market reset, I focus on the stocks that repair first.
Those are often the names with real relative strength — and the ones most likely to lead the next move higher.
This is exactly the process I share inside JLA (JLawStock Academy) :
💡How to read the market in real time.
💡How to define the most likely scenario.
💡How to know what would confirm or invalidate it.
💡How to identify real leadership after a reset.
💡How to spot the opportunity before it becomes obvious.
The goal is not to be perfect.
The goal is to think clearly when the market becomes noisy. 🧠
That is what separates a real trading process from hindsight commentary.
And that is what I want JLA members to learn:
Not just what I think about the market — but how to think through the market.
If you want to learn more about JLA, visit: https://t.co/u3LNwLXYaa
When markets crash, the hard part usually isn’t the chart work.
It’s keeping your emotions under control.
Most traders have a system, a plan, clear rules.
But when your P&L swings tens of thousands in a day, all of that gets stress‑tested.
Fear, anxiety, regret, anger – these emotions can destroy more than the sell‑off itself.
Over the past decade, I’ve traded through multiple crashes, panics, collapses and violent corrections.
What I’ve learned is this:
Your long‑term results are not decided by how well you predict the market,
but by whether you can stay rational when the market is at its messiest.
In this post I’m sharing four mindset and strategy shifts I consider most critical.
I hope they help you make better decisions the next time the market tanks.
📎What’s the mistake you’re most likely to make in a big sell‑off?
💬Tell me in the comments
🆕 Champion’s trading method — now on IG too.
👉 Follow us: IG@jlawstock2
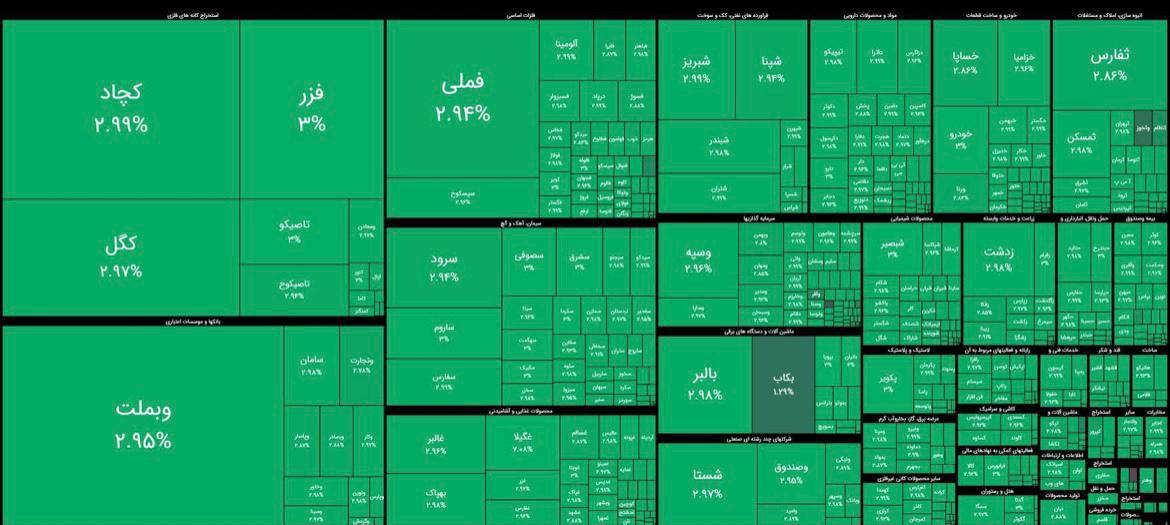
🇮🇷 Every single stock on the Tehran Stock Exchange closed green today. Not one in the red.
First time in the exchange's history.
Iran's market is pricing in the deal before the ink exists. When a population that's been cut off from the internet for 5 months sees every stock go green on the same day, they know something is coming.
The Supreme Leader hasn't signed. The terms are still disputed. The market already decided.
Source: Middle East Spectator
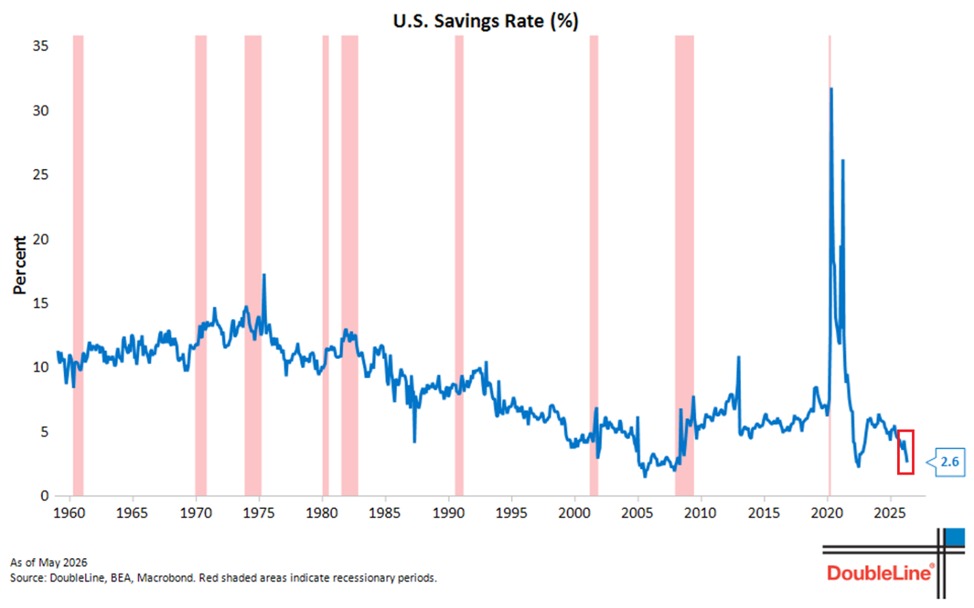
BREAKING: The US personal savings rate fell -0.6 percentage points in April, to 2.6%, the lowest since June 2022.
This marks the 3rd consecutive monthly decline for a cumulative drop of -1.7 percentage points.
This is also the 2nd lowest reading since April 2008.
This comes as consumer spending surged +5.7% YoY in April, outpacing personal income growth of +2.5% YoY, the widest gap since 2022.
This also marks the 12th consecutive month that consumer spending growth has outpaced income growth.
Put simply, rising costs of living are increasingly forcing consumers to cut into their savings to keep up.
American households are running out of savings as inflation takes its toll on their budgets.
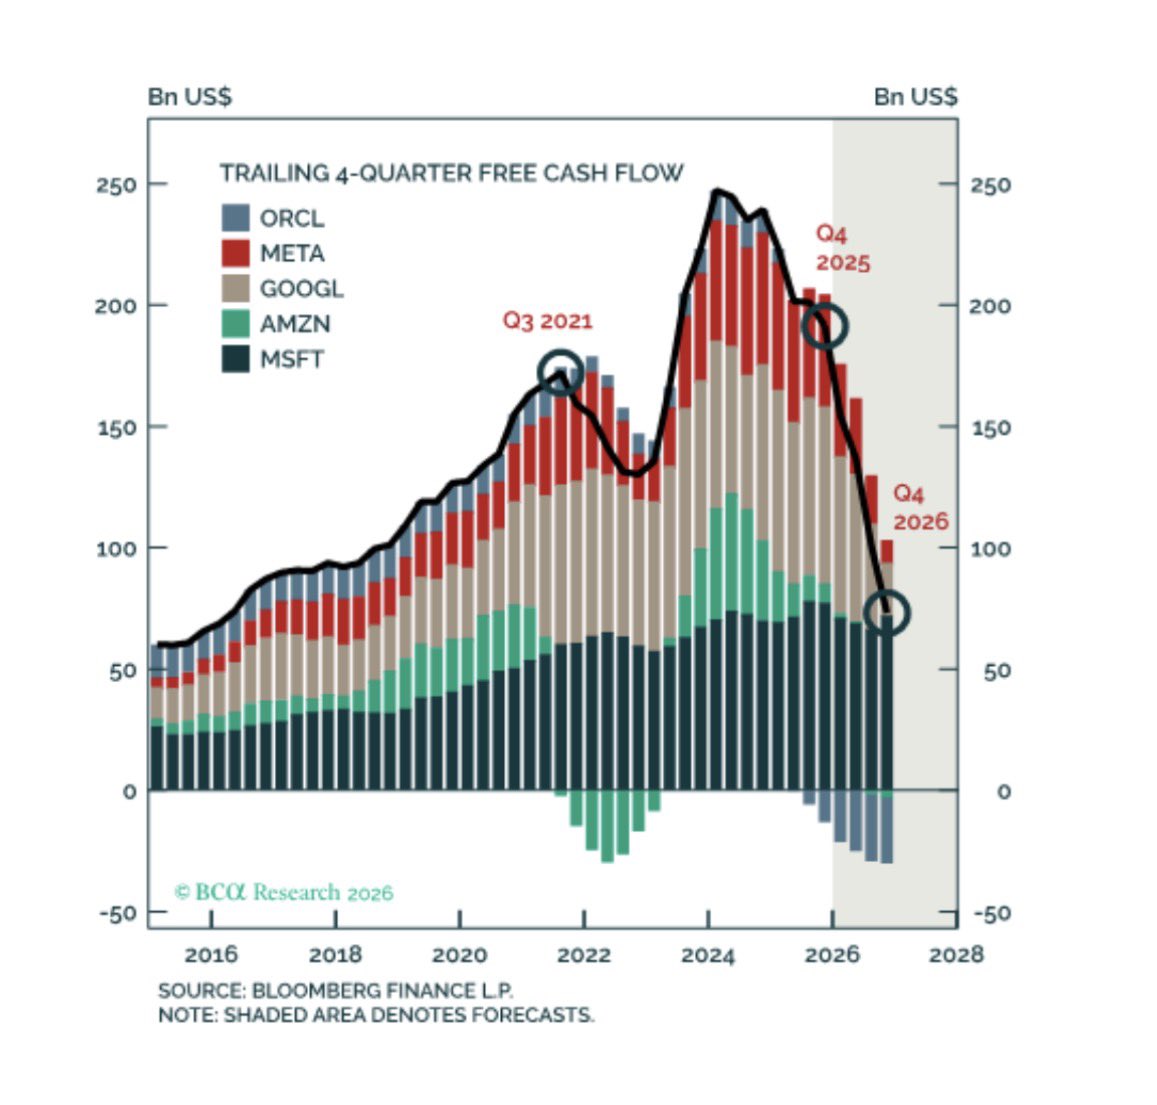
🚨 THE ENTIRE AI BOOM MIGHT BE BUILT ON FAKE REVENUE.
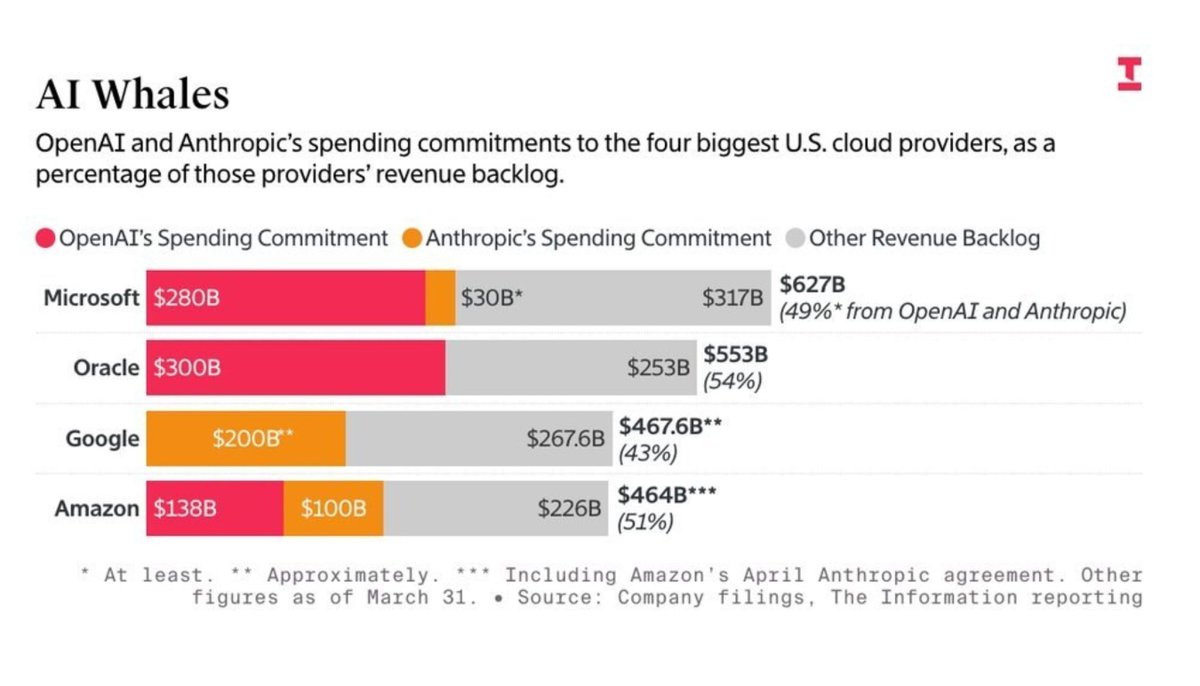
Latest corporate filings show that OpenAI and Anthropic alone make up over half of the entire $2 trillion future cloud backlog held by Microsoft, Oracle, Google, and Amazon.
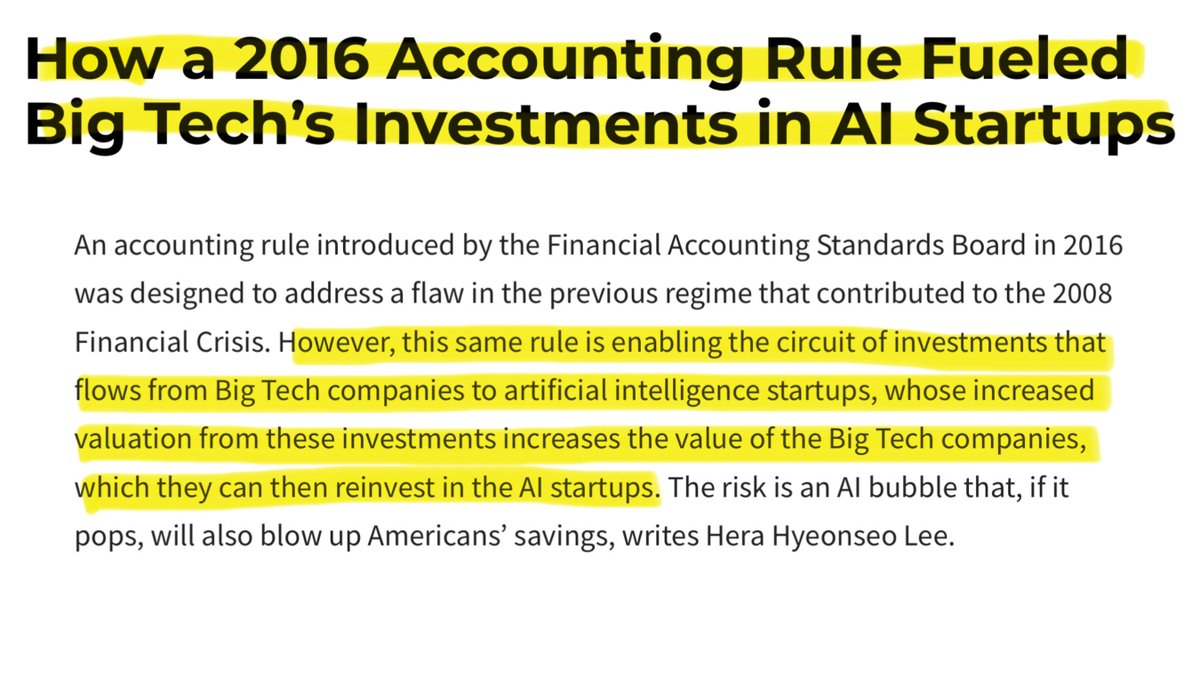
This massive pipeline is actually being created through a circular accounting trick called a round trip revenue loop.
But how it works ?
A tech giant gives billions of dollars to an AI startup as an "investment". But hidden in the contract is a strict rule forcing the startup to hand that exact same money straight back to the tech giant to rent their computer servers.
Look at the documented case of Microsoft and OpenAI.
When Microsoft invested $13 billion into OpenAI, it didn't just give them cash; it gave them "cloud credits" to use Microsoft servers. OpenAI used those exact credits to train its AI models, and Microsoft then turned around and recorded that server usage as brand new "cloud revenue" from a customer.
The tech giant is literally paying itself with its own money and calling it a sale.
This is why OpenAI’s annual cloud bill has ballooned to over $60 billion, double its actual revenue of $25 billion, kept alive solely by this recycled funding loop.
Anthropic runs the exact same play, spending $2.66 billion on Amazon Web Services in just nine months, which was basically 100% of all the money it earned at the time.
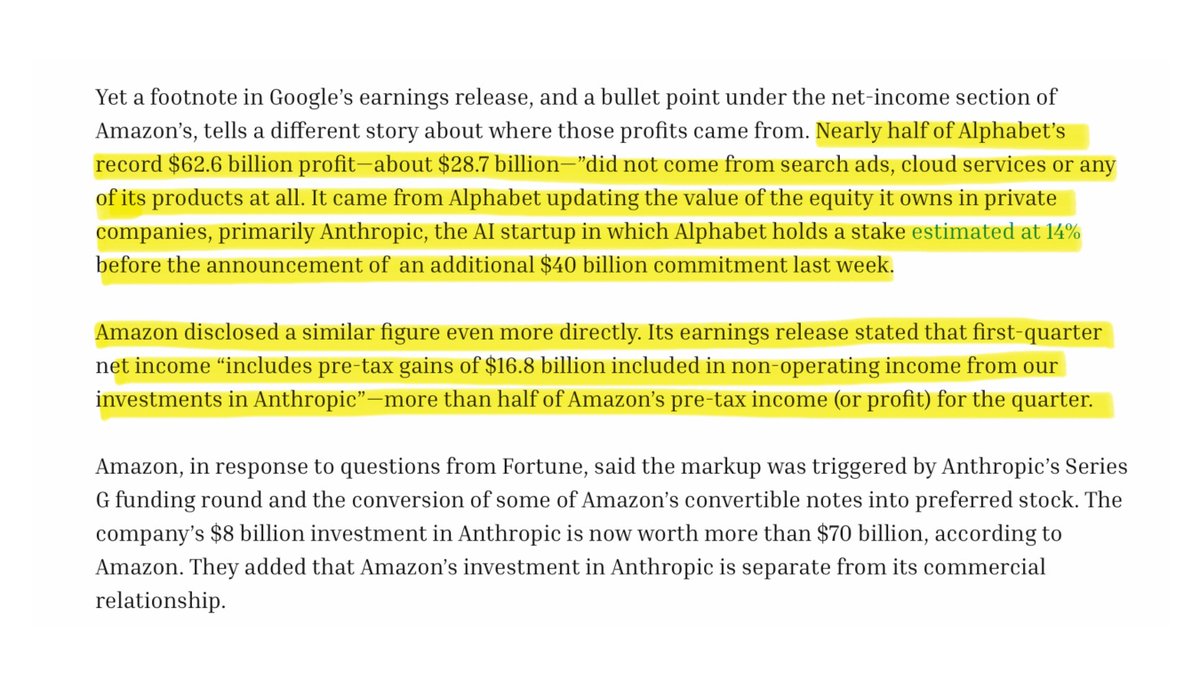
This manufactured demand triggers a second accounting trick where tech giants book massive paper profits. Every time a startup gets a higher value from a new funding round, the tech giant updates the value of its investment on its books and counts that unearned paper gain as direct profit.
In Q1 2026, Alphabet reported a record $62.6 billion profit, but $28.7 billion nearly half, was just a paper markup on its Anthropic investment. In the same quarter, Amazon reported $30.3 billion in profit, but $16.8 billion of it was just an Anthropic paper gain.
While Amazon reported record profits, its actual free cash flow collapsed 95% to just $1.2 billion because it had to spend $44.2 billion in real cash to build physical data centers.
This has created a massive danger where these giant companies rely heavily on just one or two unstable startups. Microsoft has 49% of its $627 billion future backlog tied to OpenAI, while Oracle has an incredible 54% of its entire $553 billion pipeline relying on OpenAI alone.
This perfectly mirrors the 2001 dot-com crash when Global Crossing and Qwest Communications swapped identical fiber-optic network capacity with each other just to book fake sales.
Qwest had to erase $1.4 billion in fake income, and Global Crossing went completely bankrupt.
The only difference is that the dot-com swaps were illegal, but today's AI loop is fully legal under current accounting rules.
This legal loop inflates tech company stock prices, forcing automatic retirement accounts and index funds to buy even more of these tech stocks. It is a self feeding loop where investments, sales, and stock prices all go up on paper without the AI technology ever making real cash profits.
Aramco just confirmed what the data already showed.
Even if Hormuz opens tomorrow — rebalancing takes months.
And if the closure extends a few more weeks?
Normalization pushed to 2027.
This means:
▸ June → Operational Stress Level (7.6B barrels)
▸ September → Operational Floor (6.8B barrels)
▸ 2027 → earliest possible normalization
The market is not pricing a 2027 recovery timeline.
It’s pricing a quick fix that Aramco just said won’t happen.
This changes everything.
Stop overcomplicating trading!
-Buy the breakouts.
-Cut your losses short.
-Get aggressive when trades are working.
-Cut back when they are not.
Is that so fu&^ing hard?
If it is, your probkem is in your head... read my mindset book.
https://t.co/7m60Ln2cK6
Nine billion miles of driving data just became a chip.
Tesla AI5 is finalized for production. The design files are at Samsung in Texas and TSMC in Arizona. The transistors are locked. There is no going back. Tape-out is the hardest gate in semiconductor engineering because everything before it is reversible and everything after it is silicon.
How this particular chip was designed is the most interesting part.
Nvidia builds general-purpose GPUs. They pack transistors into a full-reticle die, ship it with CUDA, and let customers figure out which operations matter. Blackwell B200 delivers 4.5 petaFLOPS at up to 1,000 watts. It runs any model for any customer. That generality is the moat and the tax. Every workload pays for circuits it never uses.
Tesla designed AI5 backward. They started with 9 billion miles of FSD inference data and asked one question: where does the neural network waste cycles? The answer was softmax computation and quantization precision loss. Two specific mathematical operations that consume disproportionate silicon area and power in every general-purpose GPU on Earth. Operations that Nvidia cannot optimize away because other customers need those transistors for different workloads.
Tesla hardened them. Burned custom quantization and softmax accelerator blocks directly into the die. Five times more efficient on those operations than any general-purpose equivalent. Then they added 10 times the raw compute and 9 times the memory capacity relative to AI4. The result: a single AI5 system-on-chip delivers roughly 5 times the useful compute of the current dual-chip AI4 configuration at an estimated 250 watts. Musk has framed a single AI5 as Nvidia Hopper class and dual AI5 as Blackwell class for Tesla workloads, at 3 to 5 times better power efficiency and roughly 10 times better performance per dollar.
This is not a chip designed to compete with Nvidia. This is a chip designed to run one thing: the learned differentiable physics engine that emerged from 9 billion miles of camera observation. Every transistor serves that engine. No wasted silicon. No generality tax. The neural network wrote its own hardware.
The chip goes to two foundries. Samsung in Taylor, Texas. TSMC in Arizona. Both American. Musk thanked both this morning and added: “It will be one of most produced AI chips ever.”
Samples arrive late 2026. Volume targets H2 2027. In the same post, Musk confirmed AI6, Dojo3, and “other exciting chips” are in active development. The 9-month cadence is real. AI6 targets tape-out by December. Dojo3 restarts on the unified architecture after Musk shut down Dojo2 last August as an “evolutionary dead end.” Intel joined Terafab eight days ago for advanced packaging. The $16.5 billion Samsung deal runs through 2033.
The chip that taped out this morning is not a product. It is the physical crystallization of 9 billion miles of learned physics into transistors optimized for the exact mathematical operations that physics requires. The software trained on the road. The silicon was designed from what the software learned. And the factory that will mass-produce it is being built in the same city where the cars that generated the training data roll off the line.
The loop is closed.
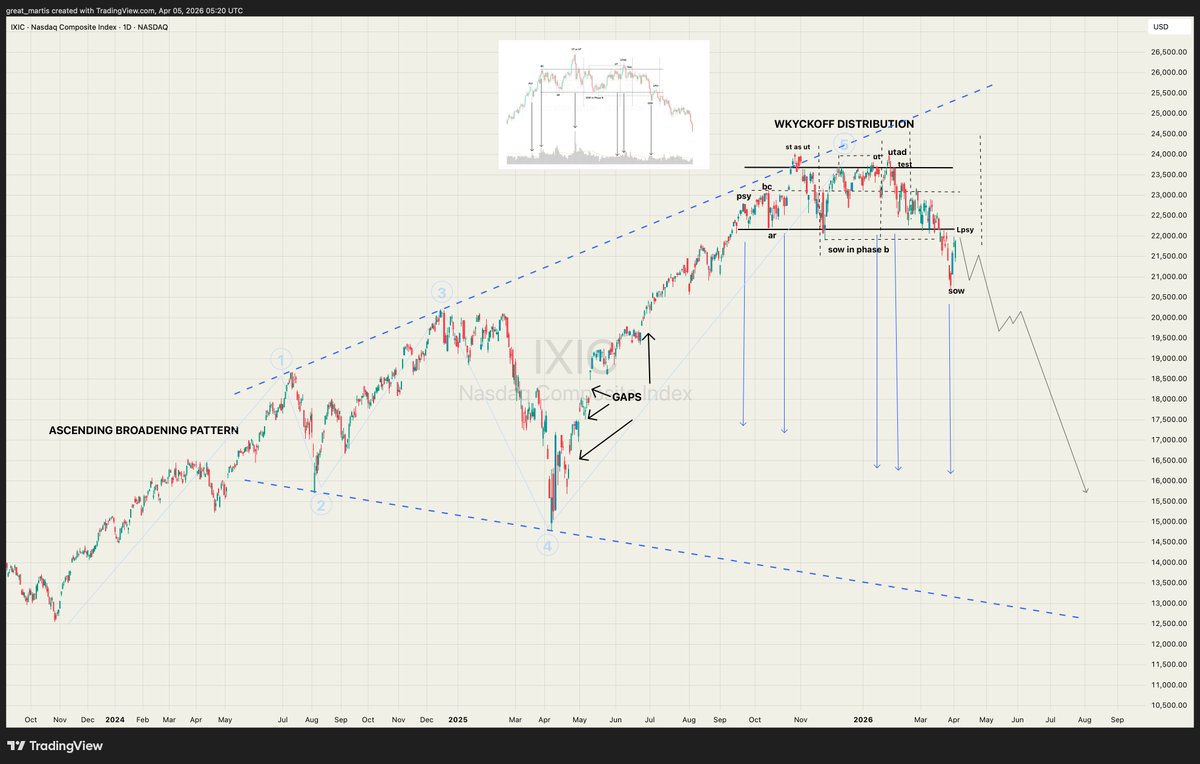
Nasdaq (IXIC) Update ✨
Wyckoff breached:
The Wyckoff Distribution we were watching has now been decisively breached below the key support (that horizontal AR/SOW line in Phase B). The last point of supply (LPSY) failed, the sign of weakness (SOW) has accelerated, and the whole structure has flipped into markdown mode.
But here’s the bigger picture that makes this move extra dangerous the Ascending Broadening Pattern (Edwards & Magee textbook style) that has been building across the entire 2024-2025 rally is now fully activated.
Edwards and Magee describe the Ascending Broadening Pattern as one of the most reliable and most violent reversal formations in technical analysis. It forms when price action creates a megaphone shape: successively higher highs (buyers getting more aggressive on the rallies) combined with successively lower lows (sellers stepping in harder on the reactions). The two trendlines diverge, volatility expands dramatically, and the swings get wider and wilder with each oscillation. They explain this pattern reflects a market that is losing control pure emotional trading where the public is chasing strength while professional money is distributing aggressively. Volume usually spikes on the up-swings and can stay elevated on the down swings, confirming the lack of real conviction behind the advance. Unlike symmetrical triangles or clean channels, this broadening formation screams “indecision at the top” and is almost always a major top reversal pattern.
Add to that the multiple major gaps left behind during the parabolic melt up phase (clearly marked on the chart). Those gaps are still wide open and sitting much lower. In a classic post distribution markdown, price has a very high probability of filling them as it seeks equilibrium especially once the broadening pattern is live and the Wyckoff structure has failed.
We are now in the zone where the real downside acceleration can happen.
Stay sharp ,stay vigilant, remain diligent.
Your truly,
The Great Martis.✨
She's beautiful.📉
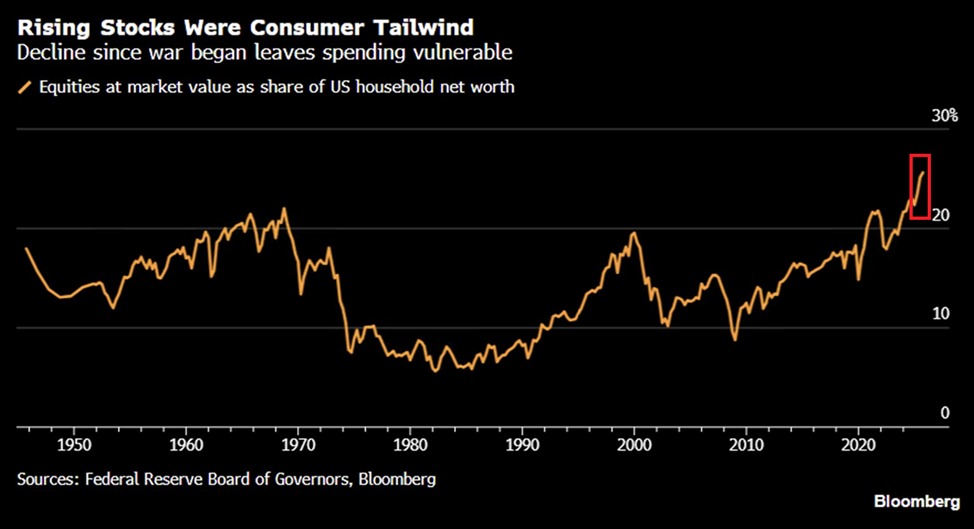
US household exposure to the stock market has never been higher:
Equities now make up 25.63% of total US household net worth, the highest since data began in the 1940s.
This surpasses the 2000 Dot-Com Bubble peak of 19.56% and the 1968 high of 22.01%.
The percentage has almost TRIPLED since the 2008 Financial Crisis low of 8.77%.
This means a significant correction in stocks could trigger a sharp pullback in spending, particularly among higher-income households who drive a significant part of consumption.
Consumer expenditures currently represent ~69% of US GDP, near an all-time high.
The US economy has never been more dependent on stock market performance.
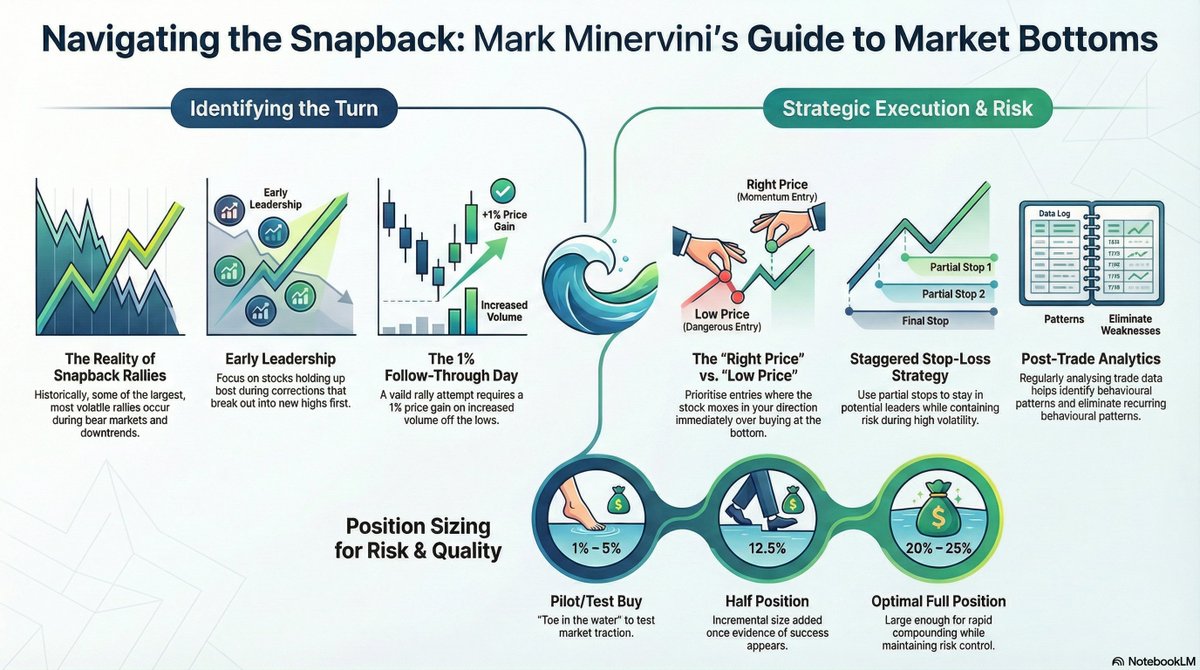
Today’s market strength was textbook. This is exactly what markets do during corrections when they get stretched to oversold levels. As I said just recently, "some of the biggest rallies occur during bear markets and corrections." Today was a perfect example.
Traders rushed in after headlines hit that Iran’s president signaled a willingness to end the conflict with the U.S. The Dow exploded higher by 1,125 points. But let’s not confuse cause and effect. The news may have been the trigger, but the market was already set up for a rally. It was oversold and primed. Now comes the part where discipline matters.
We ignore the first few days of a rally attempt. That’s potential noise. What matters is whether the market can follow through and whether leadership begins to emerge and proper setups develop.
Technically, this is a classic snapback: Indexes that broke below the 200-day are rallying back toward it, while Indexes that held the 200-day are bouncing off it. That’s typical countertrend behavior until proven otherwise.
Expect volatility to remain elevated. That’s not where low-risk money is made, but it's certainly where the risk is. Your job during corrections is simple: identify the stocks showing the best relative strength and the tightest price action. Those are your future leaders when the market finally turns.
On the macro side, nothing has been resolved. Higher crude prices are still a problem. Yesterday’s rally did nothing to materially bring down oil. The bigger issue is still in play and the jury still out. Oil at these levels feeds inflation, pressures growth, and gives the Fed a reason to stay on hold longer. Yields stay elevated in that environment.
To cut through all the noise, I look to the market itself, which has a much better track record of telling us the truth than the politicians, the analysts, the news, and the gurus.
The four steps of the bottoming process are:
1. Oversold – The difference between an ordinary pullback and an oversold condition starts with price, but it does not end there. Poor breadth and and a lack of volume confirmed follow through describe a one-sided market, and one not to trust.
2. Rally – Inevitably, the market bounces from its oversold condition. A high-quality rally is broad-based. A low-quality rally is defined by short covering and driven primarily by the stocks that have declined the most. Again, the character of the rally is important to distinguish. So far, we simply don't have enough data to make a confident determination, so patience is the watch word while we wait.
3. Retest – After the rally, there is almost always a retest. The popular averages approach, and in some cases breach, their oversold lows. The key to a successful retest is less selling pressure, such as fewer stocks below their moving averages, fewer stocks, sectors, and markets making new lows, less total volume, and less downside volume. If the retest fails, the process reverts and we generally start looking for divergences during lower lows. In the event of unexpected news, it is possible for the market to recover in a "V" fashion with no retest. In that case, we look at breadth confirmation and participation.
4. Breadth thrusts – In the final phase, not only do benchmark indices rally sharply with few pullbacks, but they do so with an extremely high percentage of stocks, sectors, and markets participating, or what technical analysts call breadth thrusts. In rare cases, the market has skipped step 3. With strong enough breadth, retests are not necessary. The Covid bottom is an example of a pretty powerful V-shaped recovery.
Bottom line:
This was an oversold rally, sparked by headlines—but not defined by them, and certainly not confirmation of a reliable bottom.
Now we watch:
--Quality of follow-through
--Emergence of leadership
--Market internals and model health
If the rally lacks quality, if economic pressure builds, or if leading stocks begin to deteriorate, then this remains what it likely is—a rally within a correction.
Stay objective. Let the market prove itself. If you are going to trade, do so incrementally.
https://t.co/JXzFFTmMtn
Back to the market. Oil is surging, volatility is expanding, and sentiment is quickly turning bearish—that’s your first clue. When fear spreads wildly, you have to start thinking contrary. But let’s be clear: Powell has signaled he’s on hold until there’s clarity out of the Middle East. That means uncertainty remains the dominant force—for now.
After last week’s meeting, Fed Chair Jerome Powell emphasized that further evidence of easing inflation is required before additional policy easing is considered: “If we don’t see that progress, then you won’t see the rate cut.”
Market expectations have shifted. In just a week, bond traders moved from anticipating rate cuts to pricing in roughly a 50.0 percent probability of a rate hike by October. In Europe, markets are now pricing in as many as three ECB rate hikes by year-end.
Recession risk is rising as the Iran conflict prolongs and oil prices are elevated. A slowing U.S. economy could hurt corporate profits and also exacerbate emerging stresses in the private credit market.
At some point, we’re going to get a sharp snapback rally. That’s inevitable. But don’t confuse a reflex rally with a new uptrend. Some of the most powerful rallies happen inside bear markets and major corrections—they trap the impatient and reward them with whipsaw action.
The market is news driven. If this conflict resolves quickly and favorably, we could see a classic V-shaped recovery. If not, the market is going to likely need time to repair to establish a durable bottom.
Oil will eventually present a good shorting opportunity. Equities will bottom. But timing is everything—and for the low-risk trader, volatility is the enemy.
That's why I’m never concerned with buying at the lowest price—I want the right price. I want alpha, and I want it fast and efficient.
Grinding for pennies in chaotic conditions is for gamblers and action jumkies. Those are hard-penny environments—and that’s where amateurs get chopped up.
Professionals have what I call sit-out power—the discipline to wait for easy-dollar conditions, when the odds are clearly in your favor. How long do they wait? As long as it takes. That's where the discipline comes in.
https://t.co/JXzFFTmMtn
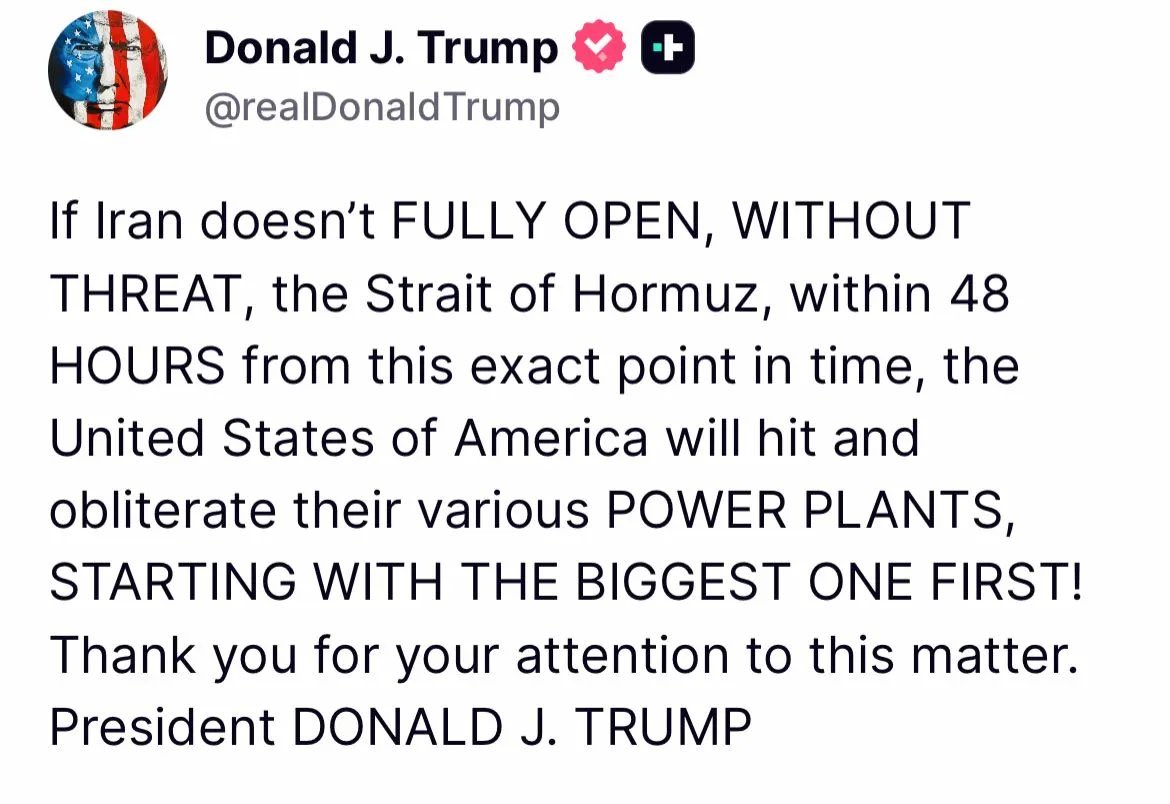
JUST IN: President Trump threatened to destroy Iran’s power grid. Iran retaliated & responded by threatening to destroy the Gulf’s water supply. The 48-hour ultimatum just became a mutual hostage crisis where the hostages are not soldiers. They are 90 million Iranians who need electricity and tens of millions of Gulf residents who need desalinated seawater to drink.
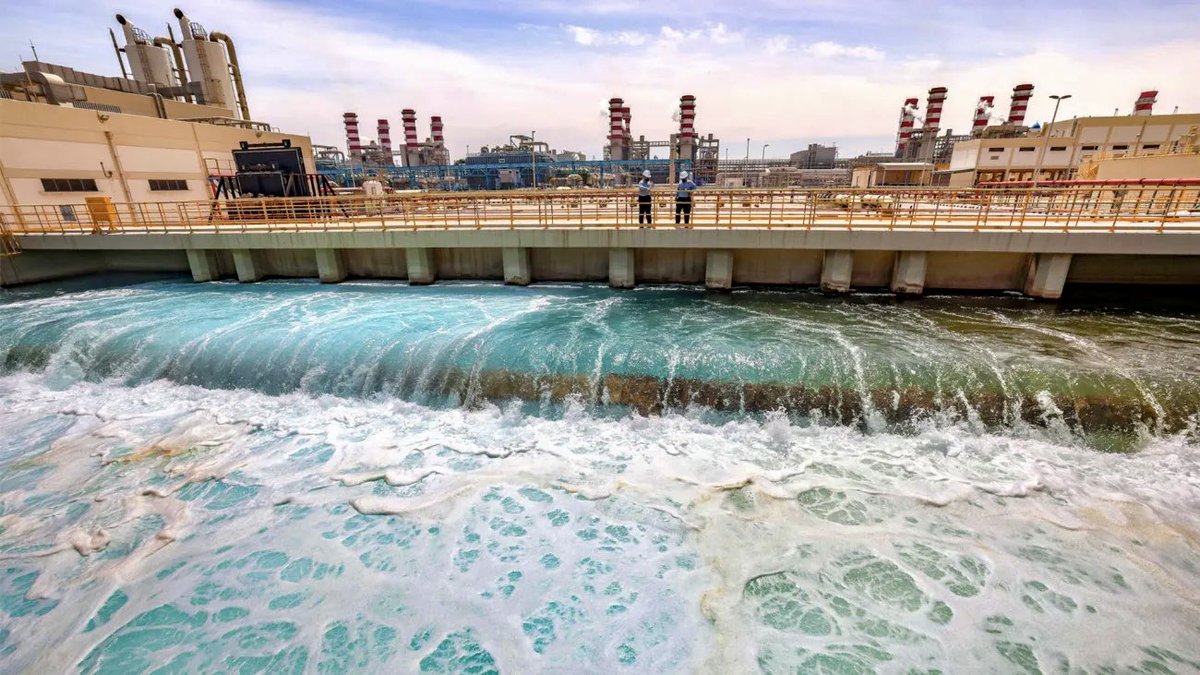
Iran’s Foreign Minister Araghchi and military officials warned through Tasnim that any US strike on Iranian power plants will trigger immediate attacks on Gulf energy infrastructure and desalination facilities. This is not about oil. Kuwait gets 90 percent of its drinking water from desalination. Qatar gets nearly 99 percent. Bahrain 85 percent. Saudi Arabia 70 percent. The UAE 42 percent. The Gulf produces 40 percent of the world’s desalinated water through 400 facilities, with 90 percent of output concentrated in approximately 56 large coastal plants sitting on shorelines within 350 kilometres of Iranian launch positions.
These are not hardened military installations. They are open-air industrial complexes powered by fossil fuels, processing seawater into the liquid that comes out of taps in Riyadh, Abu Dhabi, Doha, and Kuwait City. A single cruise missile into the Jubail desalination complex in Saudi Arabia, the largest in the world, threatens water supply to the capital. There are no wells under Riyadh sufficient to replace it. There are no rivers. There is desalinated seawater from the coast or there is evacuation.
The precedent already exists. On March 7, strikes damaged a desalination plant on Iran’s Qeshm Island, cutting water to 30 villages. An Iranian drone struck a Bahraini facility the following day. The infrastructure has already been hit from both sides. What Iran is now threatening is not a first strike on water. It is an escalation of targeting that has already begun, calibrated to match whatever the United States does to Iranian civilian power generation.
This is the escalation ladder that has no rungs left. Trump’s 48-hour ultimatum threatens to plunge Iran into darkness. Iran’s counter threatens to cut water to populations that have no natural freshwater alternative. The humanitarian math is symmetrical and devastating on both sides. Iranian hospitals lose power. Gulf hospitals lose water. Both outcomes produce mass civilian harm within days. Neither side can execute its threat without triggering the other’s response.
The Gulf states that co-signed the 23-nation Hormuz statement calling on Iran to cease hostilities are now the states whose water supply Iran has explicitly identified as a retaliatory target. Three of the statement’s signatories, Bahrain, the UAE, and the host country itself, the UAE, depend on desalination for the majority of their drinking water. They signed a document condemning Iran. Iran responded by naming the infrastructure that keeps their citizens alive.
The 48-hour clock is running toward March 23. If it expires and Trump strikes power plants, the cascade is not hypothetical. Iran hits desalination. Gulf water supplies collapse within days. Millions of people in the world’s wealthiest per capita nations face a water emergency that no amount of oil revenue can fix because the plants that make the water run on the electricity that comes from the power grid that Iran will target in return. The destruction is circular. Each side’s retaliation enables the other’s next strike.
Oil gets the headlines. Helium gets nothing. Water gets less. But water is the threat that turns a military confrontation into a civilisational emergency. You can survive without oil. You can survive without helium. You cannot survive without water. And 48 hours from now, the survival calculation may no longer be theoretical.
https://t.co/iFmUcarGdV
BREAKING: Bahrain just confirmed that an Iranian drone struck a water desalination plant. Material damage. No supply disruption. No casualties.
Those last two words will not remain true if this continues.
Yesterday Iran accused the United States of striking a freshwater desalination plant on Qeshm Island, claiming water to 30 villages was cut. Foreign Minister Araghchi posted the exact words: “The U.S. set this precedent, not Iran.” No independent verification of the Qeshm strike exists. Today Bahrain’s Interior Ministry confirmed an Iranian drone caused material damage to one of its desalination facilities. Whether or not the Qeshm accusation is accurate, the sequence it triggered is real. Iran invoked a precedent. Then it acted on that precedent. Water infrastructure is now in the crosshairs.
This is the threshold that should not have been crossed. The asymmetry in water vulnerability is not in Iran’s favor but it is not in the Gulf’s favor either. It is in nobody’s favor. It is the one domain where escalation produces mutual catastrophe with no winner.
The Arabian Peninsula has no rivers. It has almost no natural freshwater. Eight of the ten largest desalination plants on earth sit along the Gulf coast. Kuwait gets 90 percent of its drinking water from desalination. Bahrain’s dependency is comparable. Saudi Arabia 70 percent. One hundred million people across the Gulf states drink water that was seawater hours earlier, converted by machines running continuously at massive scale, connected to power grids and intake pipes that are among the softest targets in any military theater.
Iran is not invulnerable. Qeshm Island sits in the Strait of Hormuz with no freshwater alternatives. Iran’s accusation, verified or not, has placed water infrastructure into the rhetorical and operational vocabulary of this war. The confirmed Bahrain strike proves the rhetoric has already become action. That is a different category from oil depots or airports. Oil is wealth. Water is survival.
In 1991 Iraq released millions of barrels of crude into the Gulf to contaminate Saudi and Kuwaiti desalination intakes. Recovery took years. In 2026 the same vulnerability exists with one critical difference: the Strait of Hormuz is closed. Emergency water tanker imports face the same insurance withdrawal that stopped oil tankers. The redundancy system depends on shipping lanes that no longer function.
Bahrain reports no supply disruption from today’s strike. Strategic reserves provide weeks to months of buffer depending on the country. The immediate threat is not a water crisis tomorrow. The immediate threat is that a norm has been broken. No confirmed deliberate strike on a Gulf desalination plant occurred in the first eight days of this war. That restraint is now gone. And the thirty one autonomous IRGC provincial commands that I have written about operate under a doctrine where the central restraint that governed target selection died with Khamenei.
The hand that held the leash is dead. The water plants are now on the target list. And one hundred million people who cannot survive without them are living inside the consequence of that escalation.
https://t.co/ULBgEzYvKA
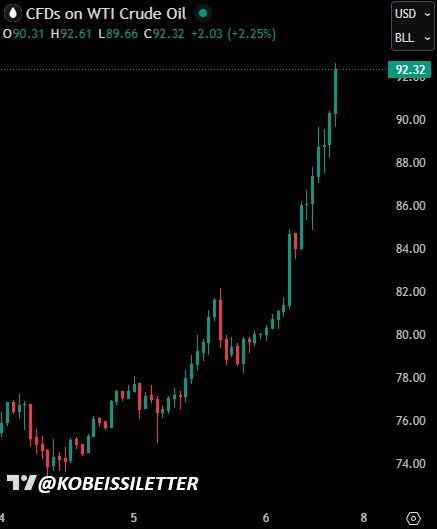
This is truly incredible to watch:
5 minutes ago, US crude oil prices surged above $91.50/barrel.
Now, we are above $92.50, adding +$1/barrel in 5 minutes.
This puts prices up +$12/barrel in 9 hours.
We are witnessing a historic short squeeze as we speak.
🚨WARNING🚨
Whilst most ponder and wonder, yours truly will provide clarity and the probable path moving forward.
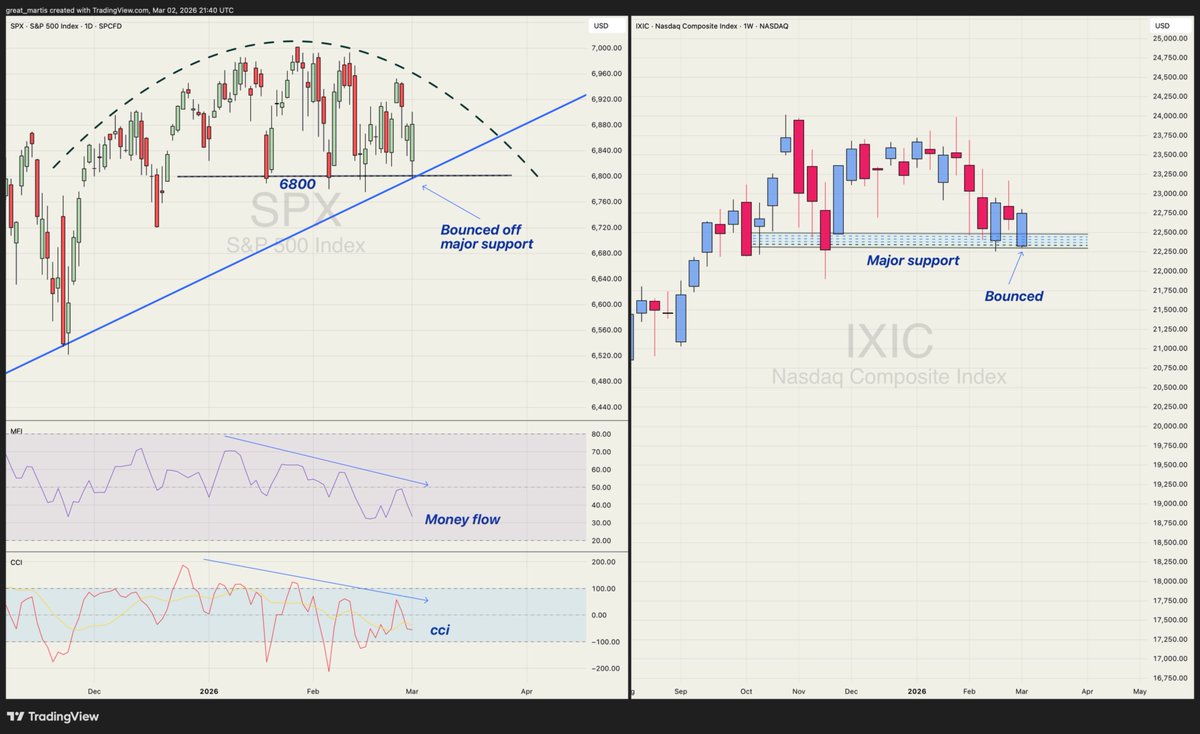
S&P 500 & Nasdaq composite index✨
The major levels of support shown below on both indices are their event horizon. They are so significant that if breached, the broadening patterns, rising wedges, and rounding tops that I keep updating will be activated. The millions of programs and technical eyes on these levels triggered immediate buys, and so we witnessed and for some, a very confusing bounce.Whilst retail traders scratch their heads in confusion, yours truly continues...Don't be fooled ....you would have noticed large dumps and wild swings during this process. That's called mass distribution to the confused and vulnerable cattle.
Please oh great one ..what will happen next ..
I shall oblige this question with my decades of experience...As now the lows of these critical levels have been tested once again, they have weakened. The next breach will not be forgiving. The programs and technical eyes will flip and begin to sell aggressively to those still willing to buy ....mostly retailers diving in head over heels. This is precisely where the bulk of the volume for that big red candle will concentrate: just under major support.Once the retailers finally realise that major support has been lost, they will add fuel to the fire in panic, and so it begins.
No room for complacency
Stay vigilant.
Yours truly,
The Great Martis.✨
The Strait of Hormuz:
1. Has never been fully closed in modern history
2. Sees 20 million barrels of oil flows per day, or 20% of global consumption
3. Is only 21 miles wide at its narrowest point, allowing for easy control
4. Closure would likely result in oil prices surging above $100/barrel
5. Accounts for almost all of Qatar's LNG exports
All eyes are on this crucial passage.
🚨 BREAKING: AI can now build trading algorithms like Goldman Sachs' algorithmic trading desk (for free).
Here are 15 insane Claude prompts that replace $500K/year quant strats (Save for later)