New open data release: Buildings of Winnipeg. To access the data and read more about the methods, please visit: https://t.co/s5G5gPolYN
video cc Steve Kim https://t.co/xLVoZfPB7q
Checkout our preprint: https://t.co/WZGojbx88S - An Open-Access and Interactive Database for Centimeter-Scale Aerial Imagery to Uncover Global Tree Mortality Dynamics
https://t.co/ZzHpxDVQqJ
Our multidecadal annual time series of dominant tree species layers for Canada are now available on the #GEE Community Catalog! 🛰️🌲🌳🗺️🇨🇦
Explore the data here:🔗https://t.co/AVCMOaoqU8
Read more about our work: 📰https://t.co/bDHUa3BIMQ
From the annual maps we summarized the distribution and dynamics of the dominant tree species from 1984 to 2022 in Canada’s forested ecosystems as well as at the ecozone level and with focus on fire and harvest disturbances.
Time series tree species maps for Canada’s forested ecosystems from 1984 to 2022 at 30 m spatial resolution using #Landsat imagery, topographic and climate data, and cal/val data from Canada’s NFI.
37 species, 39 years, 650 Mha!
Paper: https://t.co/bDHUa3CgCo
#opendata & info⬇️📜
In this (our first!) open data release, we are sharing over 1.4m GIS-ready canopy shapes for the City of Winnipeg. Each shape contains canopy height, crown area, and canopy density.
To download and read more https://t.co/gdBKAVj9hs 🌲🌳
@AgathaCzekajlo @umanitoba@cityofwinnipeg@ManitobaGIS 🙏 indeed! Age + species are tricky for the LoD needed in city models. Do you have any recommended lit on this data gap?
I also wonder when people visit cities or new parks how often they say things like “look at those large trees” or “look at these old oaks”
We're looking for a postdoc position in the IRSS!📢
🛰️ Canada-wide mapping of forest fuel attributes
📍@ubcforestry, Vancouver
🗓️ Jan 1 2025
🔗https://t.co/CuaCrtwDtp
Application details in the link above ☝️
@PFC_CFS #remotesensing#postdocjob
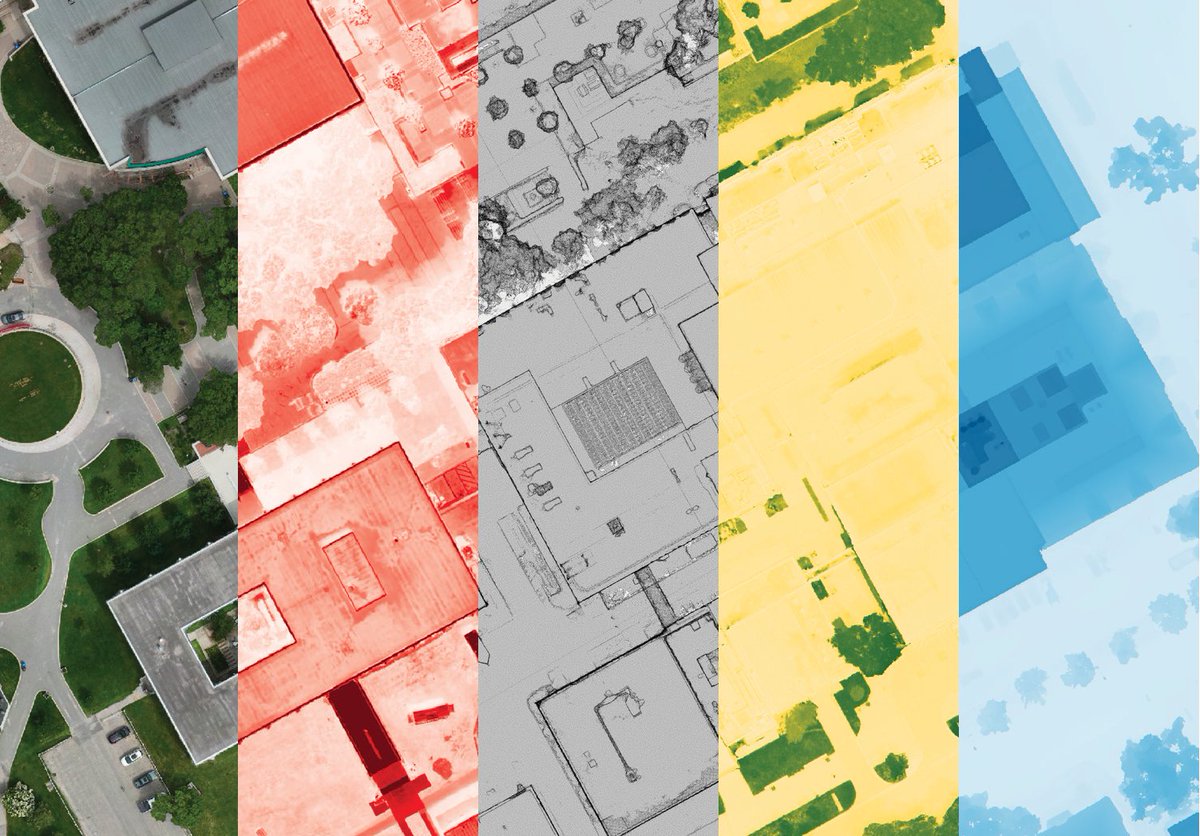
After 50+ hours of flights and 2TB+ images captured, we are excited to share the first iteration of a step-by-step guide on digital aerial photogrammetry, with a focus on implementations in #landscapearchitecture#urbandesign#urbanforestry
📒PDF: https://t.co/DfMuYp45vW
T-4 days!
Srilalitha Gopalakrishnan (Dr) from the Future Cities Laboratory Global, Singapore-ETH Centre will join us later this month to talk about #density, #greenness, #landscapearchitecture, and #biophilicdesign.
Details + RSVP: https://t.co/dtF9dEQktL
@fortiain@bradneuberg@arjenvrielink@Meta@WorldResources@EarthBlox@planet I agree with one of the pros you listed in the review. It seems to me (at least visually) a decent tree mask layer. I used it yesterday to filter my tree top (ALS-derived) data. For the actual tree height, point cloud remains my top choice. But again, not everywhere has ALS data.
USGS Scientist Dr. Chris Crawford led the efforts to document the rationale, contents and advancements provided by #Landsat Collection 2 in a newly published paper.
Access the paper here to learn more: https://t.co/mPiJB1Km2G.
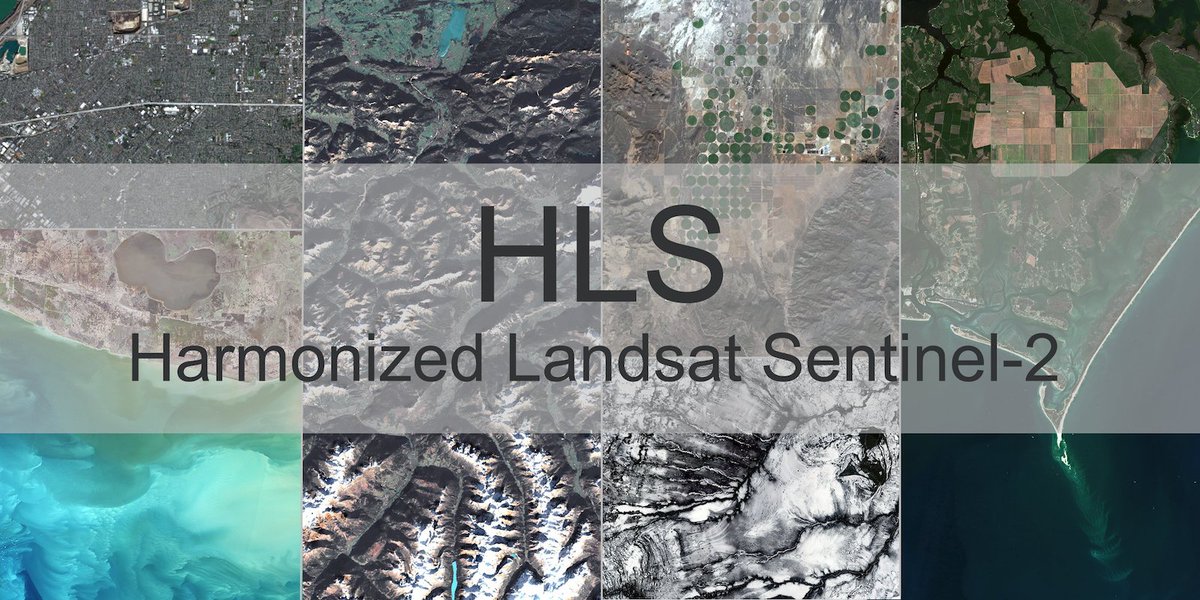
Historical processing of the complete Harmonized #Landsat and #Sentinel-2 (HLS) data and imagery archive is complete. Users can now access continuous HLS data and imagery from 2013 to present.
Read more: https://t.co/E9Bjyg2h2D
Check out the new publication in @NatureComms on the unequal distribution of building data in OSM from the team at @GIScienceHD. Data also available via the 🧵 below...
https://t.co/hGMIq9PF4D