We often use 7-point ratings to measure people's preferences and attitudes (e.g., “how much do you like X?” 1=not at all, 7=very much). In a new paper (just accepted at @APA's Decision; full paper at the end of thread), I demonstrate a problem with such rating measures. (1/n)
New paper with an honours student looking at sleep, psychological distress, and tech use in high school students and how they differ between weekdays and the weekend.
Adolescent sleep, distress, and technology use: weekday versus weekend https://t.co/hpyKZLyfef
Excited to share our review on #Health and #WellBeing at #Work published in Personnel Psychology. I learned so much working with my co-authors @SabineSonnentag and @hadarnes
https://t.co/3NkTuu6NOt
My newest paper (with David Wagner, @KiraSchabram, and @DorianBoncoeur), about human sustainability. I think this is the most important paper I have ever been a part of. https://t.co/s6Q0LGXA8V
[1/n] I recently offered a free Zoom "intro to R" data visualization workshop after popular demand. Specifically, I went through the use of ggplot2. All disciplines with no prior R skills were welcome. All free materials are below!🧵 @PhDVoice@AcademicChatter@OpenAcademics
In press at Organizational Research Methods: How to address collider bias, bivariate indirect range restriction, and similar selection effects in a variety of research settings, including primary studies and meta-analyses. Preprint and supplement: https://t.co/wU2i6fqshf
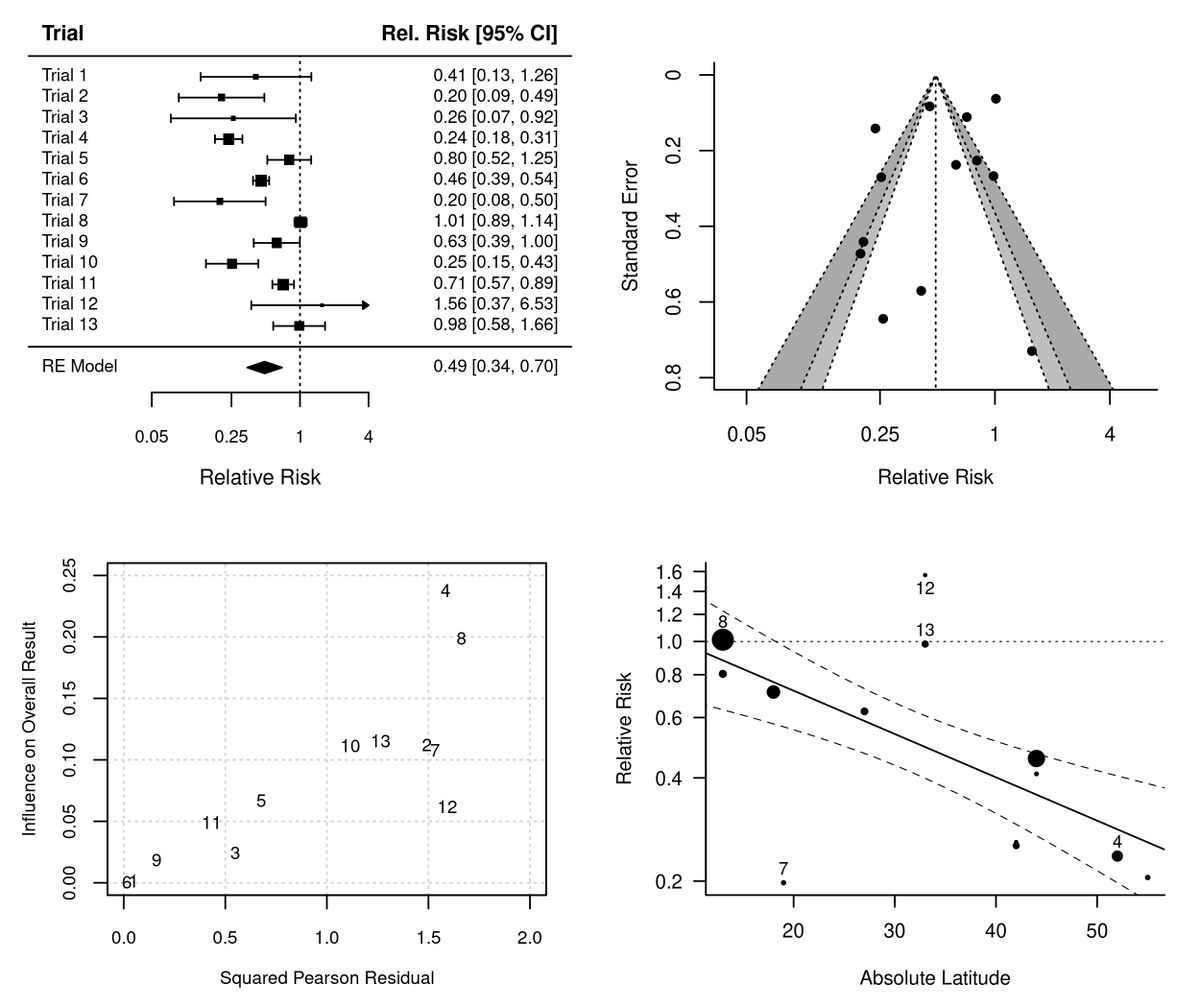
Were I to ban one statistic from meta-analysis reporting, it's I^2. Why? It doesn't tell you anything more than the random-effects variance estimate* itself. In fact, as a proportion of RE to total variance, I^2 tells you less**.
* = which has its own issues
** = get off my lawn
I like my wearable devices like I like my emotions….validated. Check out the new paper from @drdeanjmiller and team validating 6 wearables for sleep and HRV 👇
I am running my three-day meta-analysis course this year, November 2-4. The course provides a thorough introduction to meta-analysis and (surprise!) the use of the metafor package for conducting the analyses in R. Further details can be found here: https://t.co/mN6sBuJj3W
Every Thursday, from 5pm (CET/CEST) until 8pm (approx), I run the 'Open Online R Stream', an open live stream where I teach R, some stats, and play some smooth jazz. More info (the schedule, topics, general format) can be found on my website: https://t.co/2Qudur2Rdh
August reminder for meta-analysis folk:
I-squared estimates between-study heterogeneity❌
I-squared is a test for between-study heterogeneity❌
I-squared > 50% means large heterogeneity❌
I-squared measures proportion of total variability due to between-study heterogeneity✅
A 🧵 on burnout
Yesterday I learned that when people are burnt out, their amygdala enlarges. For all you non-neuroscientists, here's what that means and why it's important. 1/
#AcademicChatter@AcademicChatter@CouragePhD
Measurement invariance testing using confirmatory factor analysis and alignment optimization: A tutorial for transparent analysis planning and reporting. https://t.co/Ajyh9yARTI