AbsolutZero is the least amount of possible energy. Trading Stocks. Strongly short biased. My tweets are just my opinions. I'm not an investment advisor.
TradingView x Claude Code is insane for vibe-coding custom trading indicators.
What used to take hours of coding and expert technical knowledge is now just one Claude prompt away.
Gaining a market edge has never been easier.
This is free sauce - FULL cheatsheet:
Wow. I genuinely shouldn't be posting this.
I just vibe-coded a market indicator with Claude Code, which printed buy signals that returned +190%, +95%, and +85%.
Claude Code is literally the most powerful trading quant of all time.
Here's exactly how I built it (copy me to build your own)
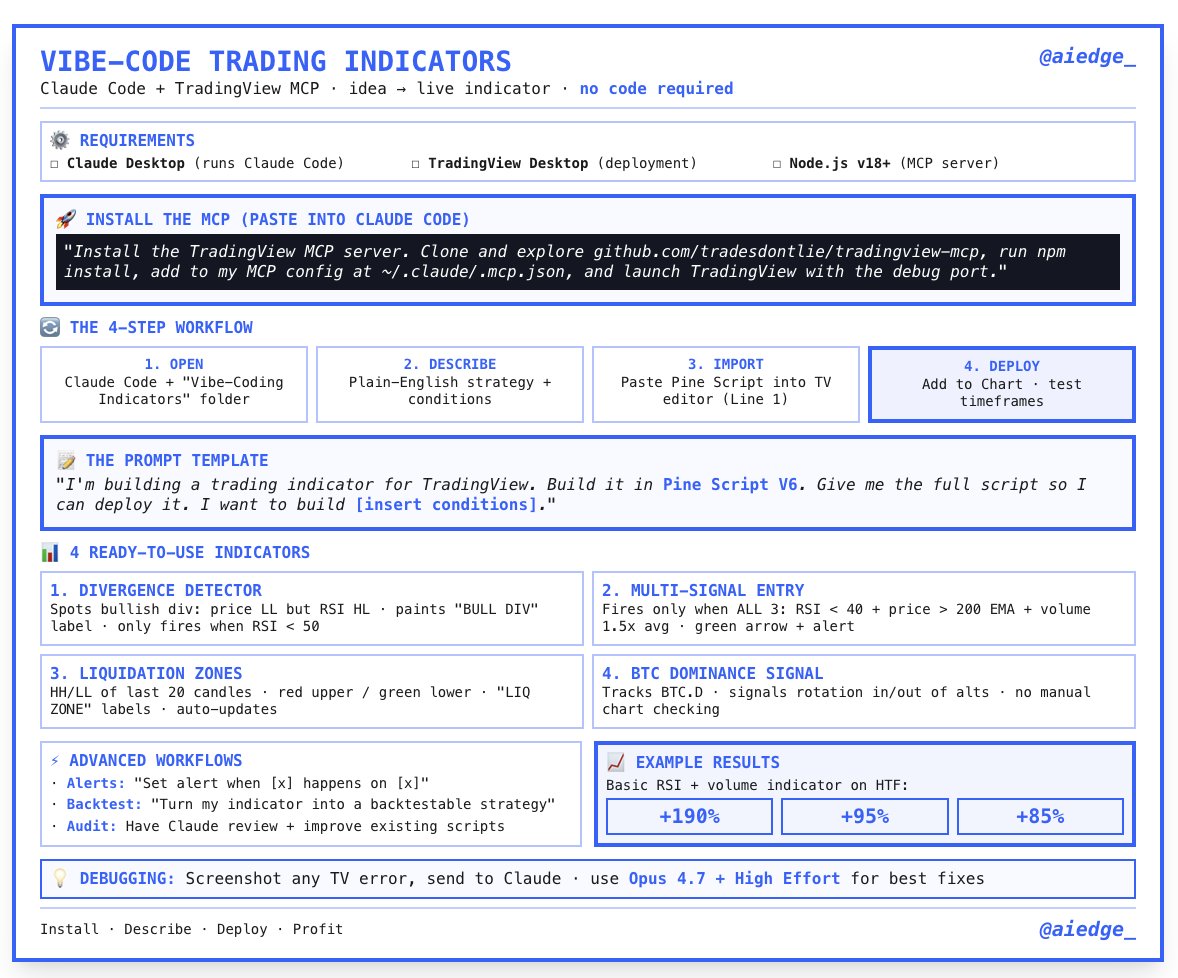
Step 1. Make sure you have these requirements:
• Claude Code Desktop App
• Node.js v18+ installed on your computer
• TradingView Desktop App
• The TradingView MCP installed (full guide here on my page under "Articles")
Step 2. Open Claude Code
On your local desktop device, create a new folder titled "Vibe-Coding Indicators" and open it inside a fresh Claude Code chat.
This is your dedicated workspace - every indicator you build will live here.
Step 3. Start building your indicators
You have a few options here:
a) Build indicators based on your own pre-existing market strategy.
b) Source market strategies online.
c) Use Claude to help build a strategy from scratch.
Some things to consider:
• What conditions need to be true for a signal to fire?
• What do you want to see on the chart?
• What timeframe do you want to focus on? (I've found that trying to code indicators for multiple timeframes doesn't work well; just stick to HTF or LTF)
Describe all this the same way you'd explain it to another trader; the more specific you are, the better the output.
Step 4. Use this prompt structure
"I'm building a trading indicator for TradingView. I want you to build it in Pine Script V6 and give me the full script so I can deploy it. I want to build an indicator for [insert conditions]."
Example: "I want a buy signal that only fires when RSI is below 40, price is above the 200 EMA, and the current candle volume is at least 1.5x the 20-period average. Paint a green arrow below the candle when triggered."
Claude will then write your full Pine Script.
Step 5. Deploy it to TradingView
Copy the entire code block Claude generates.
Inside TradingView:
Click "Indicators, metrics, and strategies" in the top menu.
Scroll to "My Scripts" and create a new script.
Paste the entire Pine Script Claude gave to you (make sure to start on line 1).
Finally, click "Add To Chart."
Done. Your indicator is live.
Step 6. Take it to the next level
Once you're comfortable with the basic flow, you can:
• Add alerts: "Set an alert anytime [x] happens on [x] indicator."
• Backtest it: "Turn my indicator into a backtestable strategy."
• Audit it: "Improve this indicator and make it more accurate."
• Steal strategies: Have Claude scrape strategies from elite traders on the web
I can't believe more people aren't talking about this.
My full article guide for this exact setup is live now, and I will handhold you through every step (see my profile).
Save this so you don't forget it!
The world's most-watched sex expert just broke down what's actually destroying your sex life, your testosterone & your lifespan.
Here are the 10 wildest things she exposed (THREAD):
(1/10) People who have sex once a week live 49% longer...
Bill Ackman turned $30 million into $1.5 billion on a company the entire world called a fraud, and the SEC investigated HIM for being right
bought a stock at 34 cents that went to $31, lost $4 billion on a single trade, went through a divorce, investors left
came back with a 45x return managing $15 billion with just 41 people
an hour of raw, unfiltered Wall Street from one of the most aggressive investors alive ↓
Two brothers bought half the world's silver supply, their position hit $9.8 billion
you will watch silver go from $2 to $50 an ounce, the richest family in America corner an entire commodity market
And the exchange do something so unprecedented it wouldn't happen again for 40 years
Bookmark & Watch it. The platform in the post below lets you build and deploy trading strategies with one prompt ↓
Market Wizard Linda Raschke's 12 Technical Trading Rules
1. Buy the first pullback after a new high. Sell the first rally after a new low.
2. Afternoon strength or weakness should have follow‑through the next day.
3. The best trading reversals occur in the morning, not the afternoon.
4. The larger the market gaps, the greater the odds of continuation and a trend.
5. The way the market trades around the previous day’s high or low is a good indicator of the market’s technical strength or weakness.
6. The previous day’s high and low are two very important “pivot” points, for this was the definitive point where buyers or sellers came in the day before. Look for the market to either test and reverse off these points, or push through and show signs of continuation.
7. The last hour often tells the truth about how strong a trend truly is. “Smart money” shows their hand in the last hour, continuing to mark positions in their favor. As long as a market is having consecutive strong closes, look for the up‑trend to continue. The up‑trend is most likely to end when there is a morning rally first, followed by a weak close.
8. High volume on the close implies continuity the next morning in the direction of the last half‑hour. In a strongly trending market, look for resumption of the trend in the last hour.
9. The first hour’s range establishes the framework for the rest of the trading day.
10. A greater percentage of the day’s range occurs in the first hour than was the case in the past, and thus it has become increasingly important to trade aggressively if there are early signs of a strong trend for the day.
11. There are four basic principles of price behavior which have held up over time. Confidence that a type of price action is a true principle is what allows a trader to develop a systematic approach.
The following four principles can be modeled and quantified and hold true for all time frames, all markets. The majority of patterns or systems that have a demonstrable edge are based on one of these four enduring principles of price behavior. Charles Dow was one of the first to touch on them in his writings.
Principle One: A Trend Has a Higher Probability of Continuation than Reversal
Principle Two: Momentum Precedes Price
Principle Three: Trends End in a Climax
Principle Four: The Market Alternates between Range Expansion and Range Contraction
In the world of money, which is a world shaped by human behavior, nobody has the foggiest notion of what will happen in the future. Mark that word – Nobody! Thus the successful trader does not base moves on what supposedly will happen but reacts instead to what does happen.
CLAUDE CODE PUEDE AHORA EXTRAER DATOS EN VIVO DE MÁS DE 17.000 ACCIONES, PRECIOS DE CRIPTOMONEDAS Y ESTADOS FINANCIEROS EN SEGUNDOS.
Un comando. 60 segundos. Listo.
Aquí está la configuración exacta:
Paso 1: Abre Claude Code y pega esto:
claude mcp add --transport http financial-datasets https://t.co/51qgRjmah6
Paso 2: Autenticación
Escribe “/mcp”dentro de Claude Code y completa el flujo de OAuth en tu navegador.
Verifica la conexión en cualquier momento:
claude mcp list
Paso 3: Comienza a formular preguntas
- "¿Cuál es la relación P/E actual de Apple y su capitalización de mercado?"
- "Muéstrame el estado de resultados de Tesla para los últimos 4 trimestres."
- "¿Cómo ha cambiado el precio de Bitcoin en el último año?"
Eso es todo.
Claude Code ahora tiene acceso directo a datos financieros reales de más de 17.000 acciones, informes de ganancias, balances generales, estados de resultados, datos de flujo de caja y precios de criptomonedas.
Los analistas que pagan $24.000 al año por una Terminal Bloomberg no van a estar contentos de que esto exista.
Antes de esto necesitabas una Terminal Bloomberg o una API compleja de datos financieros o horas de investigación manual en múltiples fuentes.
Ahora necesitas un comando y 60 segundos.
Los cuantitativos, analistas y gestores de portafolios que descubran cómo combinar el razonamiento de Claude Code con el acceso a datos financieros en vivo tendrán una ventaja en investigación que se acumula cada día.
Guarda esto en favoritos antes de abrir tu próxima cuenta
Claude Code x TradingView is the best AI trading quant of all time.
Gone are the days of AI slop market analysis - AI is now better at technical analysis than you.
Here's how you can turn Claude Code into your expert trading quant (in <5 minutes):
Step 1. Ensure you have these requirements:
• Claude Code - installed on your computer (this is what talks to TradingView)
• Node.js 18+ - installed on your computer (the MCP server runs on this)
• TradingView Desktop app - downloaded from https://t.co/1YkJpaCU8L
• A valid TradingView subscription (paid plan for real-time data)
Step 2. Open Claude Code and run the following prompt to connect the TradingView MCP:
"Install the TradingView MCP server. Clone and explore https://t.co/k1Ql1o0CYi, run npm install, add to my MCP config at ~/.claude/.mcp.json, and launch TradingView with the debug port."
Step 3. Health check
Restart Claude Code, and paste this prompt:
"Use tv_health_check to confirm TradingView is connected."
If correctly connected, Claude Code should respond with a confirmation.
Step 4. Start prompting
Claude Code now has access to your ENTIRE TradingView environment
Your charts, your technical analysis, alerts - everything.
Use this prompt to turn Claude Code into your personal market analyst:
"Act as an elite quantitative trader and technical analyst with full access to my TradingView environment.
Analyze the current market structure for [ASSET] on the following timeframes: 5m, 15m, 1H, 4H, 1D.
Use my existing indicators, drawings, and chart context to:
Identify the current trend and market regime (trending, ranging, accumulation, distribution)
Mark key support and resistance levels based on price action and liquidity
Identify liquidity pools, stop clusters, and likely areas of manipulation
Analyze momentum using RSI, MACD, and volume where available
Detect any chart patterns (breakouts, consolidations, deviations, etc.)
Evaluate confluence across timeframes
Then provide:
A clear directional bias (bullish, bearish, neutral)
The highest probability trade setup right now
Exact entry, stop loss, and take profit levels
Risk-to-reward ratio
Invalidation point (what would prove this analysis wrong)
Finally:
Explain your reasoning step-by-step in plain English.
Avoid generic statements. Be decisive.
If no high-quality setup exists, explicitly say “no trade” and explain why."
This is an EXTREMELY powerful setup - make sure to save this post so you don't forget it.
He predicted the 1987 crash.
Made $100M.
Then spent years trying to destroy this footage.
In this documentary, you’ll watch Paul Tudor Jones:
– Lose $6M in a single afternoon
– Sit back and say: “total devastation”
– Then make it all back… +100%
This will change how you see risk forever.
Bookmark this. Watch it. Then read below ↓
Jim Simons: "If you're going to trade using models, you just slavishly use the models. You do whatever the hell it says, no matter how smart or dumb you might think it is at that moment."
The best trader in history said this in a 1 hour MIT talk that shaped my entire approach to trading.
Bookmark it. Watch it. Then read the article below.
Paul Tudor Jones lleva 50 años ganando dinero en los mercados.
Predijo el crash del 87.
Su fondo siempre ha batido al S&P 500.
Reveló en una entrevista de 1 hora los 10 principios que gobiernan su vida.
1) La amabilidad es el activo más infravalorado
A trader turned $1,092 into $83,000 in 3 weeks using Anthropic’s guide and a simple 3 part setup.
No coding, no subscriptions, just a lag detection system catching the gap between spot and 5 minute markets.
You only need laptop + 1 hour/day.
Giving This Free for 24 hours. To get it:
1. Comment the word 'Anthropic'
2. Like and Retweet this post
3. Follow me @marryevan999


![milesdeutscher's tweet photo. Wow. I genuinely shouldn't be posting this.
I just vibe-coded a market indicator with Claude Code, which printed buy signals that returned +190%, +95%, and +85%.
Claude Code is literally the most powerful trading quant of all time.
Here's exactly how I built it (copy me to build your own)
Step 1. Make sure you have these requirements:
• Claude Code Desktop App
• Node.js v18+ installed on your computer
• TradingView Desktop App
• The TradingView MCP installed (full guide here on my page under "Articles")
Step 2. Open Claude Code
On your local desktop device, create a new folder titled "Vibe-Coding Indicators" and open it inside a fresh Claude Code chat.
This is your dedicated workspace - every indicator you build will live here.
Step 3. Start building your indicators
You have a few options here:
a) Build indicators based on your own pre-existing market strategy.
b) Source market strategies online.
c) Use Claude to help build a strategy from scratch.
Some things to consider:
• What conditions need to be true for a signal to fire?
• What do you want to see on the chart?
• What timeframe do you want to focus on? (I've found that trying to code indicators for multiple timeframes doesn't work well; just stick to HTF or LTF)
Describe all this the same way you'd explain it to another trader; the more specific you are, the better the output.
Step 4. Use this prompt structure
"I'm building a trading indicator for TradingView. I want you to build it in Pine Script V6 and give me the full script so I can deploy it. I want to build an indicator for [insert conditions]."
Example: "I want a buy signal that only fires when RSI is below 40, price is above the 200 EMA, and the current candle volume is at least 1.5x the 20-period average. Paint a green arrow below the candle when triggered."
Claude will then write your full Pine Script.
Step 5. Deploy it to TradingView
Copy the entire code block Claude generates.
Inside TradingView:
Click "Indicators, metrics, and strategies" in the top menu.
Scroll to "My Scripts" and create a new script.
Paste the entire Pine Script Claude gave to you (make sure to start on line 1).
Finally, click "Add To Chart."
Done. Your indicator is live.
Step 6. Take it to the next level
Once you're comfortable with the basic flow, you can:
• Add alerts: "Set an alert anytime [x] happens on [x] indicator."
• Backtest it: "Turn my indicator into a backtestable strategy."
• Audit it: "Improve this indicator and make it more accurate."
• Steal strategies: Have Claude scrape strategies from elite traders on the web
I can't believe more people aren't talking about this.
My full article guide for this exact setup is live now, and I will handhold you through every step (see my profile).
Save this so you don't forget it!](https://pbs.twimg.com/media/HH32ApdbcAImT4o.jpg)


![milesdeutscher's tweet photo. Claude Code x TradingView is the best AI trading quant of all time.
Gone are the days of AI slop market analysis - AI is now better at technical analysis than you.
Here's how you can turn Claude Code into your expert trading quant (in <5 minutes):
Step 1. Ensure you have these requirements:
• Claude Code - installed on your computer (this is what talks to TradingView)
• Node.js 18+ - installed on your computer (the MCP server runs on this)
• TradingView Desktop app - downloaded from https://t.co/1YkJpaCU8L
• A valid TradingView subscription (paid plan for real-time data)
Step 2. Open Claude Code and run the following prompt to connect the TradingView MCP:
"Install the TradingView MCP server. Clone and explore https://t.co/k1Ql1o0CYi, run npm install, add to my MCP config at ~/.claude/.mcp.json, and launch TradingView with the debug port."
Step 3. Health check
Restart Claude Code, and paste this prompt:
"Use tv_health_check to confirm TradingView is connected."
If correctly connected, Claude Code should respond with a confirmation.
Step 4. Start prompting
Claude Code now has access to your ENTIRE TradingView environment
Your charts, your technical analysis, alerts - everything.
Use this prompt to turn Claude Code into your personal market analyst:
"Act as an elite quantitative trader and technical analyst with full access to my TradingView environment.
Analyze the current market structure for [ASSET] on the following timeframes: 5m, 15m, 1H, 4H, 1D.
Use my existing indicators, drawings, and chart context to:
Identify the current trend and market regime (trending, ranging, accumulation, distribution)
Mark key support and resistance levels based on price action and liquidity
Identify liquidity pools, stop clusters, and likely areas of manipulation
Analyze momentum using RSI, MACD, and volume where available
Detect any chart patterns (breakouts, consolidations, deviations, etc.)
Evaluate confluence across timeframes
Then provide:
A clear directional bias (bullish, bearish, neutral)
The highest probability trade setup right now
Exact entry, stop loss, and take profit levels
Risk-to-reward ratio
Invalidation point (what would prove this analysis wrong)
Finally:
Explain your reasoning step-by-step in plain English.
Avoid generic statements. Be decisive.
If no high-quality setup exists, explicitly say “no trade” and explain why."
This is an EXTREMELY powerful setup - make sure to save this post so you don't forget it.](https://pbs.twimg.com/media/HHmjVwYa0AAubBu.jpg)


