The bear flag has now broken to the downside!
That means it's time to start looking at lower prices that typically come very quickly after that happens.
The next support on the Volume Profile is 38k - 43k. This is also the cycle bottom target of Realized Market Cap and the Golden Ratio Multiplier.
But... the volume there is relatively thin, much more so than our current price. The next strongest block after that is 25k - 30k. This is the bottom target of the Magic Bands and Bear Bands.
42k seems very likely as the next major stop, which will probably take some time.
Expect that people will scream that the bottom is in on the next drop, as they have for the past two. Maybe it is, maybe it isn't. The Halving Cycles Theory, which remains perfectly on track, says not until the end of the year.
This market always rewards
those who move BEFORE consensus.
I’m calling it early.
2026 WILL BE THE BIGGEST ALTCOIN SEASON EVER.
Ignore this if you want.
But don’t say nobody warned you
before the rotation hits.
AI is coming.
And this might be the last real alt run before the game changes forever.
Save it.
All I’m asking is that you pay attention.
If you still haven’t followed me, you’ll regret it.
#Bitcoin The Confirmation I'm Waiting For 👀
Zooming out to the 2-week chart provides a clearer picture.
Historically, bear markets ended when two conditions aligned:
🔸Market structure breakout
🔸Bullish LMACD crossover
$SUI Is Being Bought Up Quietly And Nobody's Talking About It
No pump. No noise. Just steady buying day after day. That's how the big moves start.
Entry Zone: $0.60 - $0.90
Targets: $5 | $10 | $20
Get in before the crowd wakes up. $10 is just a matter of time.
Save this and share it with your friends.
Not Financial Advice. ALWAYS DYOR
@SuiNetwork@Community_Sui
The cycle bottom target for the Golden Ratio Multiplier is dropping, currently at about 36k.
We're watching Level 1, which has been very accurate for previous cycle bottoms.
This is slightly below the Realized Market Cap bottom of 42.5k. I think the real answer is probably something in between.
$10 $ADA Is My Long Term Target, And Whales Are Quietly Making The Case For Me
67% Of All #CARDANO Is Now In Whale Hands, Highest Since 2020. They Stack The Bottom While Retail Rage Quits.
NFA & DYOR
$APT MAY BE IN A GENERATIONAL ACCUMULATION ZONE | $20+ FORECAST (HTF TA)
#APT Is Trading Around $1.10 Inside A Major 1W High-Risk Accumulation Zone ($0.70–$0.90) After An ~81% Correction From ATH.
Structure Is Showing Clear Descending Channel Breakdown + Liquidity Sweep + Accumulation Phase From The 2025 Capitulation
✅ High Risk Accumulation Zone: $0.70–$0.85
✅ Bullish Flip Trigger: $2 (Target 1 Reclaim)
✅ Price Must Hold Above $0.70 For Next $18 Target (HTF Macro Target)
✅ Classic Channel Breakdown + Capitulation Wick (-81%)
✅ Unmitigated Liquidity Resting Above From 2023 Range Highs
Upside Targets: $2 ➔ $5 ➔ $10 ➔ $18+ (~16X From Accumulation Zone)
Thesis: Move Labs L1 Narrative Leader Trading At A High-Confluence HTF Demand Zone After A Brutal -80.95% Markdown. Sellside Liquidity Fully Purged Below Range Lows.
IMO: APT/USDT Is Trading In A Macro Positioning Zone Before Expansion.
Purely TA Only | Not Financial Advice | Always DYOR
Your @Aptos Target This Cycle?
Like + RT + Bookmark
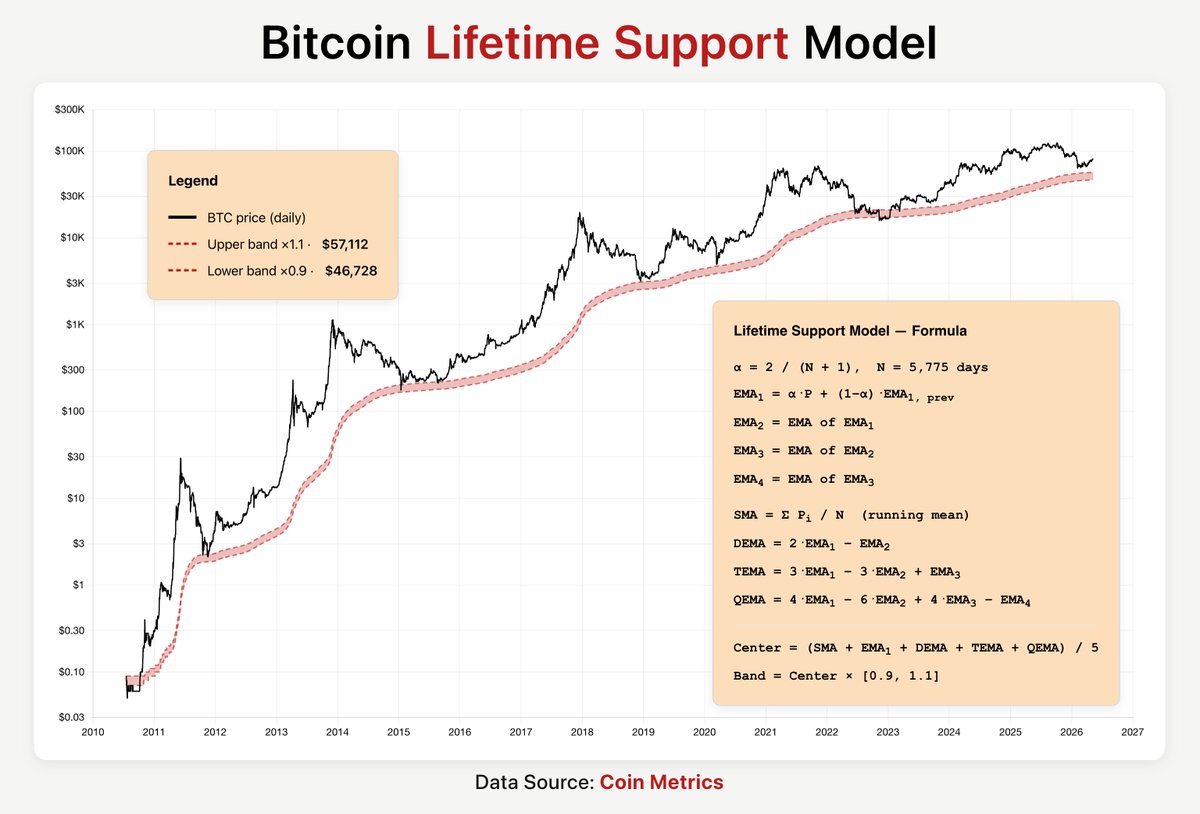
New Bitcoin Floor Model!
Simple and elegant.
Equal-weighted average of BTC's lifetime SMA, single EMA, double EMA (DEMA), triple EMA (TEMA), and quadruple EMA (QEMA), then plot a ±10% band around that average.
Upper band ×1.1 = $57,112
Lower band ×0.9 = $46,728
Massive weekly candle for $LINK vs. BTC signaling that there's more strength coming from within the #Crypto market rather than Bitcoin alone.
What is the key signal for that?
The reason that Bitcoin already went up by 40% is showing that there's more confidence within this part of the markets and therefore money flows more within the ecosystem to be looking for momentum and returns.
Massive weekly candle, breaking the 21-Week MA and looking for momentum.
This trend can last for some more weeks, and hopefully, will be strong enough to be breaking this entire downtrend.
🔥 $AVAX tarafı kimseye heyecan vermiyor… tam da böyle yerlerde hareket başlar
Herkes unutmuş gibi davranıyor ama grafik hâlâ konuşuyor 👇
📊 Grafiği Okuyalım:
🔹Fiyat düşen yapı içinde eziliyor
🔹Her yükseliş denemesi satışla karşılanmış
🔹Ama altta bir bölge var ki → tutunmaya çalışıyor
Yani piyasa şu an:
“kırılacağım ama nereye?” modunda
🔴 11.26 – 15.57 üstü kapanış gelirse
işte orası kritik dönüş alanı
➡️ 23.35
➡️ 33.35
kapısı açılır, ivme artar
🟢 7.63 altı kapanışta
ben orada hikaye aramam
➡️ 6.08 → 3.86 bandına kadar boşluk var
sert sallar
Şu an piyasa tam klasik taktiğini uyguluyor: ilgisizlik.
Kimse konuşmuyor, kimse heyecanlı değil…
ama genelde en sert hareketler tam bu psikolojide gelir.
👉 İnsanlar unutur
👉 Piyasa hatırlatır
#avax #altcoin #kripto #bitcoin
⚠️Uyarı: Grafiklerim eğitim amaçlıdır. Hiçbir şekilde yatırım tavsiyesi içermiyor. Kripto paralar riskli varlıklardır. Sizlerde kendi araştırmanızı yapın arkadaşlar.
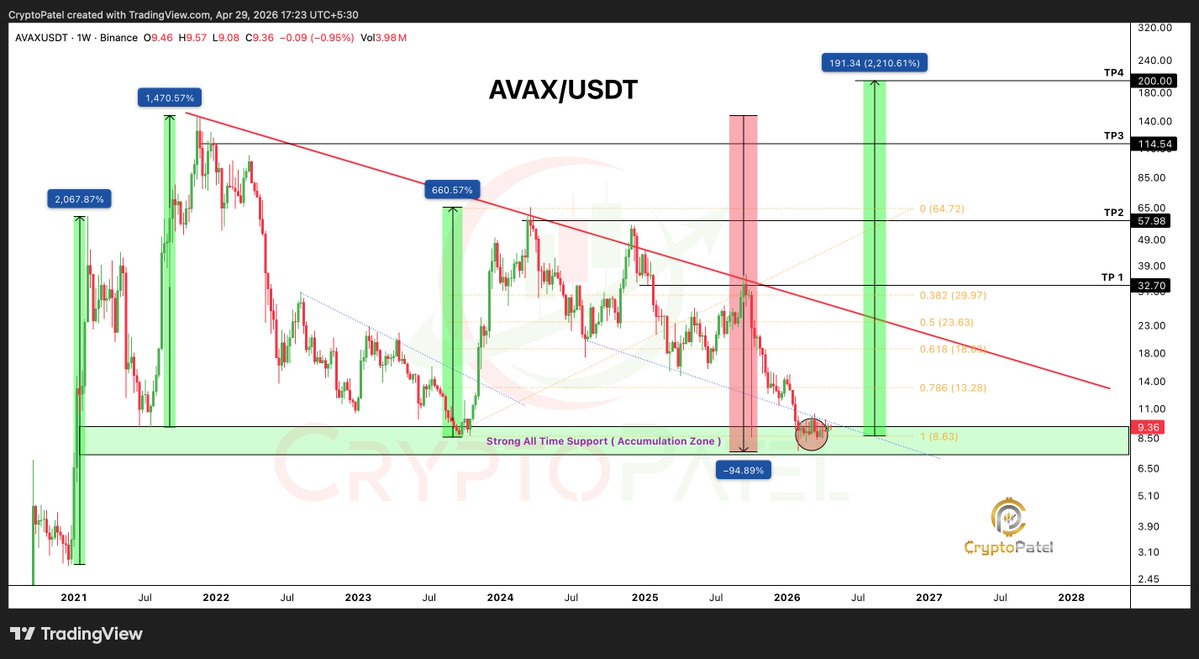
$AVAX sitting on a 5-year falling wedge support.
Third visit to this trendline. The first two produced 1,460% and 649%.
This time BlackRock and Janus Henderson are already loading.
Here's my Avalanche breakdown. 🧵👇
1/2
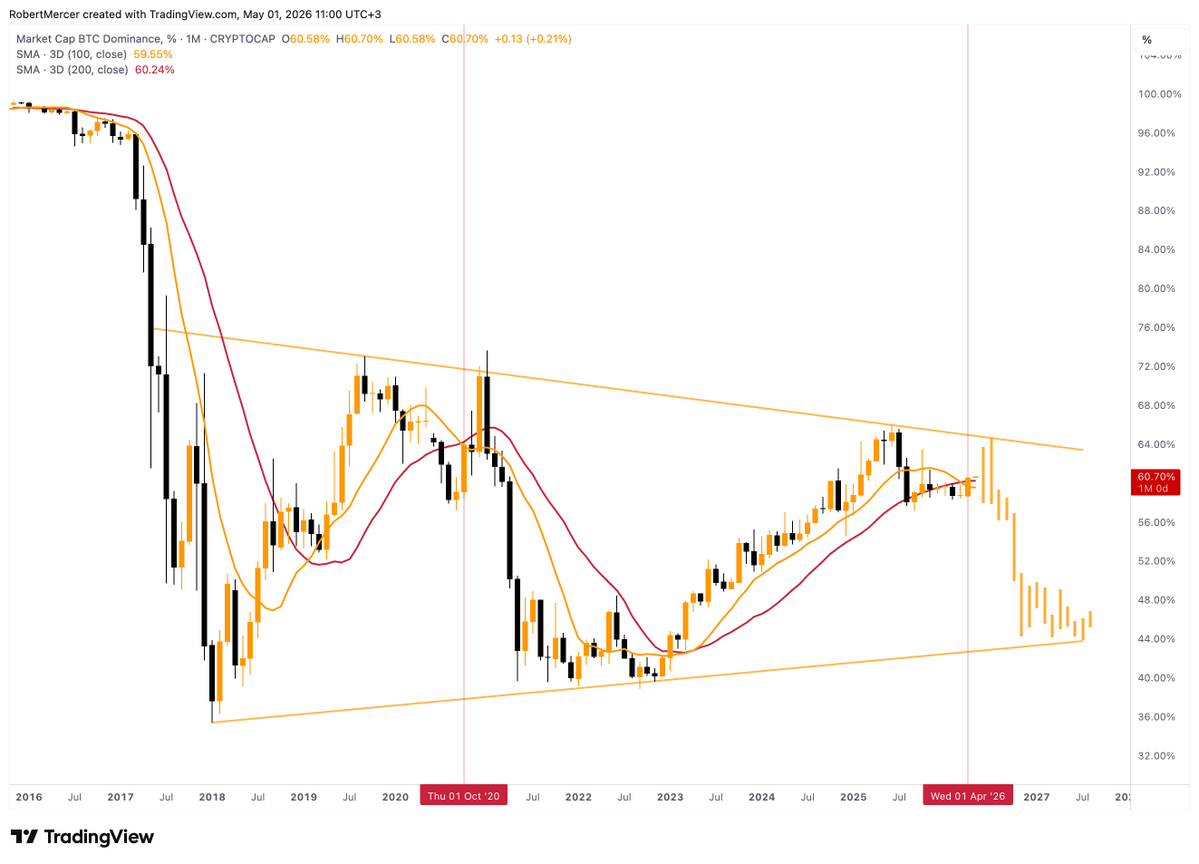
⛏️ $BTC Dominance - Death Cross on 1M Chart
This pattern formed only once in Oct 2020, right before the Biggest Altcoin Rally in Q1 2021
If history repeats, we shall see a big spike up in May followed by a downfall from 60% to 45%, which will result in a Massive Altcoin Run.
#Altcoins
Many people may not realise this, but...
Altcoins are on the verge of breaking back into the bullish ascending triangle that has been forming for over 5 YEARS.👀
This is massive, folks. You can't imagine what an important signal that would be for alts.
$AVAX Is Quiet Right Now… But The Weekly Chart Is Building Something BIG.
#AVAX Around Key HTF Support. After A Deep Multi-Year Correction, Most People Stopped Watching.
Perfect.
That’s Usually Where Smart Money Starts Re-Accumulating In Avalanche.
Look At The Structure:
2021: Massive ATH Run - Peak Euphoria.
Then Came The Multi-Year Correction.
Now?
Price Is Sitting Inside A Strong Long-Term Accumulation Zone.
Current Setup:
✅ Strong All-Time Support: $9–$7
✅ Multiple Historical Reactions From This Zone
✅ Liquidity Sweep Into HTF Demand
✅ Macro Descending Trendline Still Major Resistance
✅ Weekly Close Above $15 = Strength Confirmation
As Long As Price Holds Above $7, The Macro Bullish Bias Stays Valid.
The Play:
If Structure Expands: $32 → $58 → $115 → $200+
That’s Where The Real Move Begins.
Invalidation:
❌ Weekly Close Below $7 = Bullish Thesis Weakens
The Best Long-Term Trades Come
When Nobody Is Paying Attention.
@avax Is One Of The Most Ignored HTF Charts Right Now.
And That’s Exactly Why It Deserves Attention.
Bookmark This. 🚀