We built an interactive 3D module to teach kids how ecosystems work. Every concept is straight from our open curriculum, mapped to national standards.
Every rabbit, fox, whale and krill is a real individual. 9 species wired into one food web, all interacting in real-time.
- Tap any creature to see what it eats, and what eats it
- Tune how fast they breed, hunt and starve
- Or break one link and watch the whole web collapse
- Your mission: keep every species alive for 100 days.
This is module 2 of a giant series. We're turning the open-source @withmarbleapp curriculum into an interactive lesson for every topic kids learn in primary school.
Parents and teachers: tell us which module to build next.
Link to play below 👇
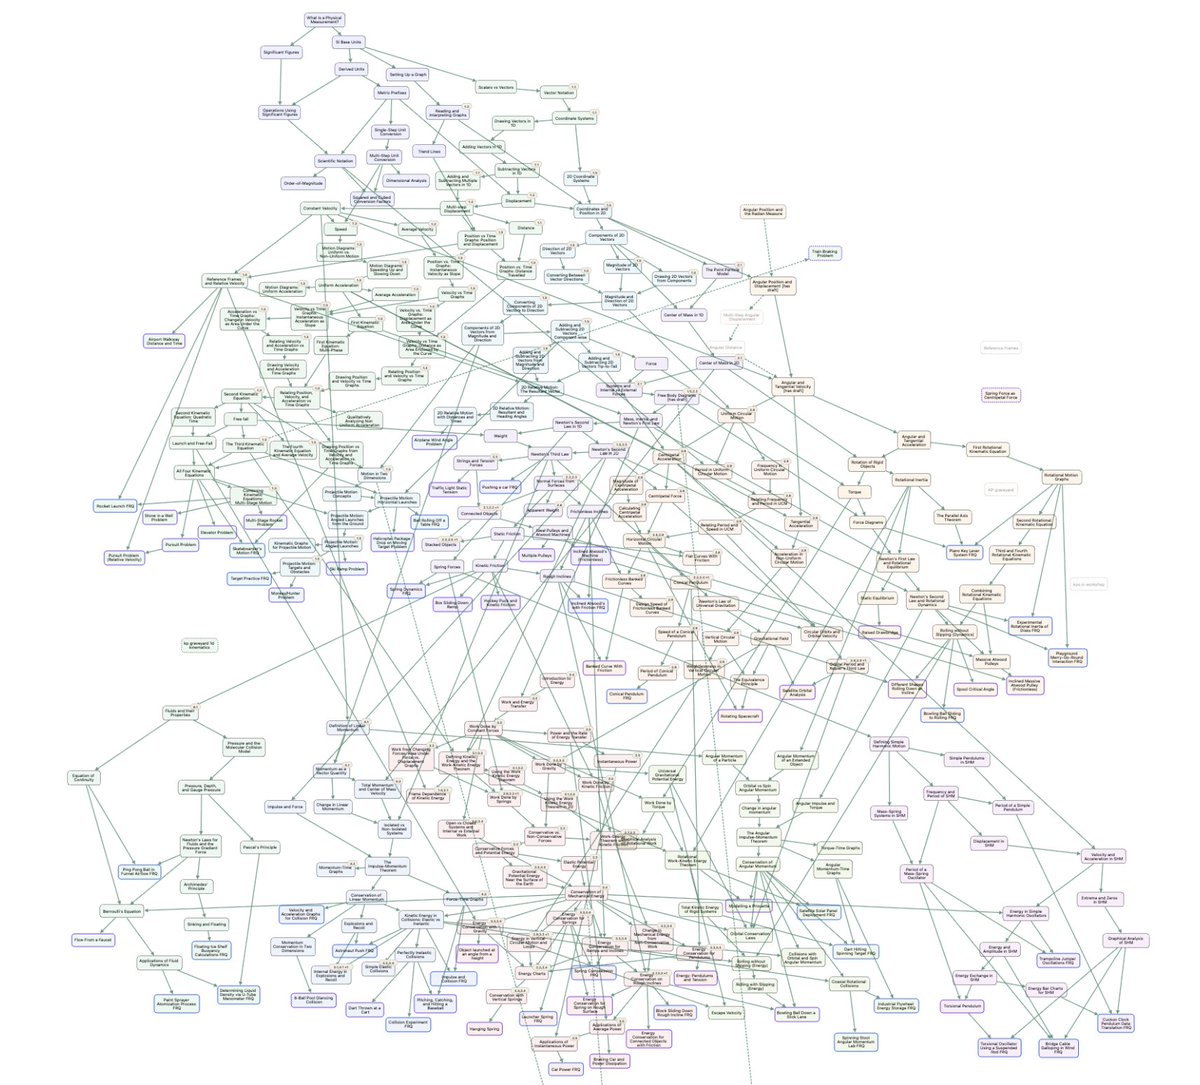
I heard you like education knowledge graphs... here's grades 1 and 2 for reading, writing, math (built this for my daughter)
Kids are incredibly capable, we're just teaching them the wrong way
Showing 463 skills, 9601 learning items, 155 hrs of productive learning time
Every subject will soon be mapped, and Colleges will become research centers that hosts workshops
All learning will soon take place locally, on your own, and will be optimized to best fit your learning style, emphasizing derivation and understanding over memorization
@_MathAcademy_ is the first proof of concept of this, and the coming years will only bring us closer to a complete map of education
One of the world’s greatest debt-generators, wiped out in an instant while simultaneously growing collective intelligence ten-fold
Imagine an aggregate view of everything your class has mastered so far
As well as detailed reports about each individual student's effort level and performance
It's not just a skill tree...
Not just a knowledge graph...
It's basically a brain visualization.
An MRI of a student's mathematical knowledge.
Once you view it in dark mode, you can't unsee it.
Something important is becoming visible across neuroscience, developmental biology and consciousness research.
These may not be competing explanations. They may be different resolutions of the same biological field architecture.
@MillerLabMIT / @dimitrispp give the measurable cortical layer: extracellular electric fields are not just passive read-outs of neural firing, but can feed back into neural ensembles through ephaptic coupling.
@drmichaellevin gives the wider biological layer: bioelectric networks coordinate cellular collectives into adaptive problem-solving systems across development, regeneration and physiology.
@StuartHameroff points to the intracellular depth layer: the cytoskeleton and microtubules may be where field effects couple into the cell’s internal architecture.
@penrose asks whether the deepest layer may require physics beyond classical computation.
These do not need to replace one another.
They may be adjacent scales of one nested closure system:
physics → cytoskeleton → cell → bioelectric tissue → neural ensemble → cognition
VFD frames the common object as field-constrained geometry: not neurons, cells, microtubules or fields in isolation, but the way each scale constrains the next through a shared dynamical structure.
The test is not mystical.
Perturb the field.
Measure the ensemble.
Measure the cell-state.
Measure the cytoskeletal response.
If patterned field changes propagate coherently across these levels, and if changing cytoskeletal dynamics, gap junctions, ion-channel states or anaesthetic sensitivity alters that propagation, then the bridge becomes experimentally visible.
We may not be looking at four unrelated theories.
We may be looking at one living architecture viewed from four different resolutions.
For anyone wondering how a kid can learn six years' worth of math in one year -- really *learn* it, not just "cover" it:
Each circle represents a topic. The darker the circle, the stronger the student's knowledge.
Students systematically master prerequisite topics before approaching more advanced ones.
While pushing forward, they interleave across many learning paths to improve transfer.
They also systematically review previously learned content at optimal intervals to strengthen long-term retention.
What you're seeing is a student's math brain getting wired up under maximum-efficiency learning conditions.
(The animation below is just for one course, a smaller subset of the entire curriculum.)
Taxonomic graph analysis of personality questionnaire data uncovers this three-tiered network.
Bottom-level facets cluster into six mid-level traits - Neuroticism, Sociability, Conscientiousness, Integrity, Openness to Experience, and Impulsivity - which organize under three meta-traits:
Stability, Plasticity, and Disinhibition.
Node colors align with the legends shown, and connecting lines indicate empirical statistical associations identified in the IPIP-NEO dataset.
It is used to refine personality assessment tools and investigate links between traits and mental health conditions.