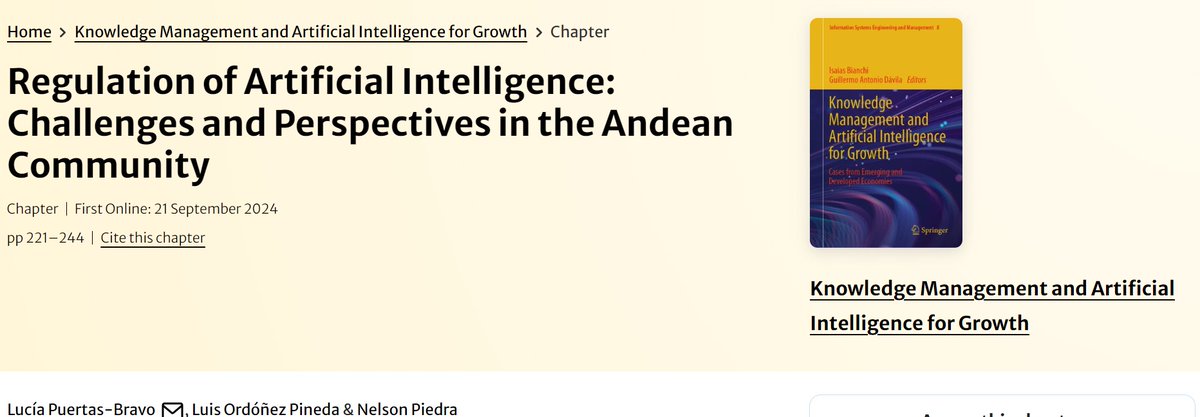
Publicada en la Editorial @SpringerNature, esta contribución la hemos elaborado, conjuntamente, con @LuciaPuertasBr —Grupo de Investigación Derechos Digitales y Protección de Datos Personales— y @nopiedra —Grupo de Investigación Knowledge-Based Systems—; y, tiene por objeto (...)
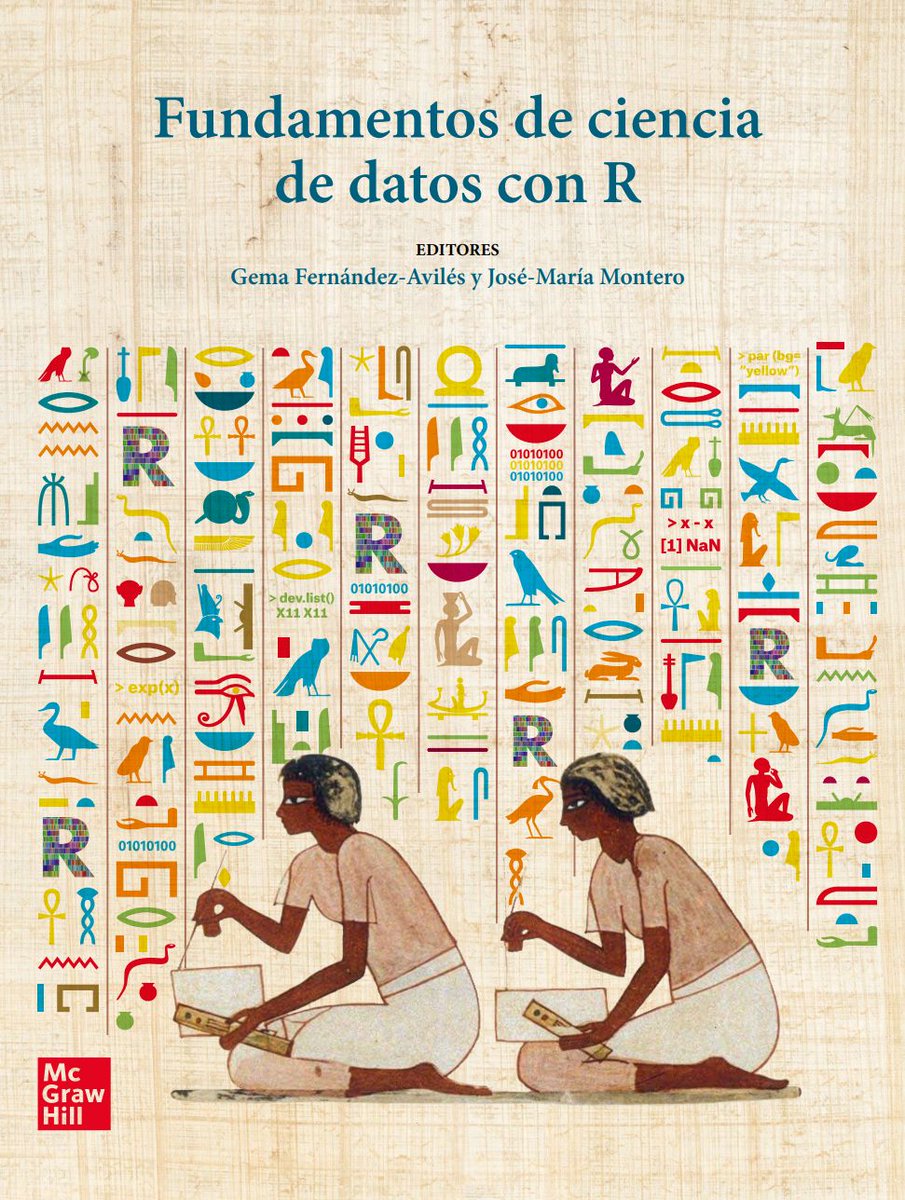
📚#DataScience en #rstats y EN ESPAÑOL
Desde el planteamiento del problema y la captura de la datos necesaria para poderle dar una solución hasta la redacción de las conclusiones finales que ha obtenido con los modernos informes reproducibles colaborativos
https://t.co/GyFlOhasJi
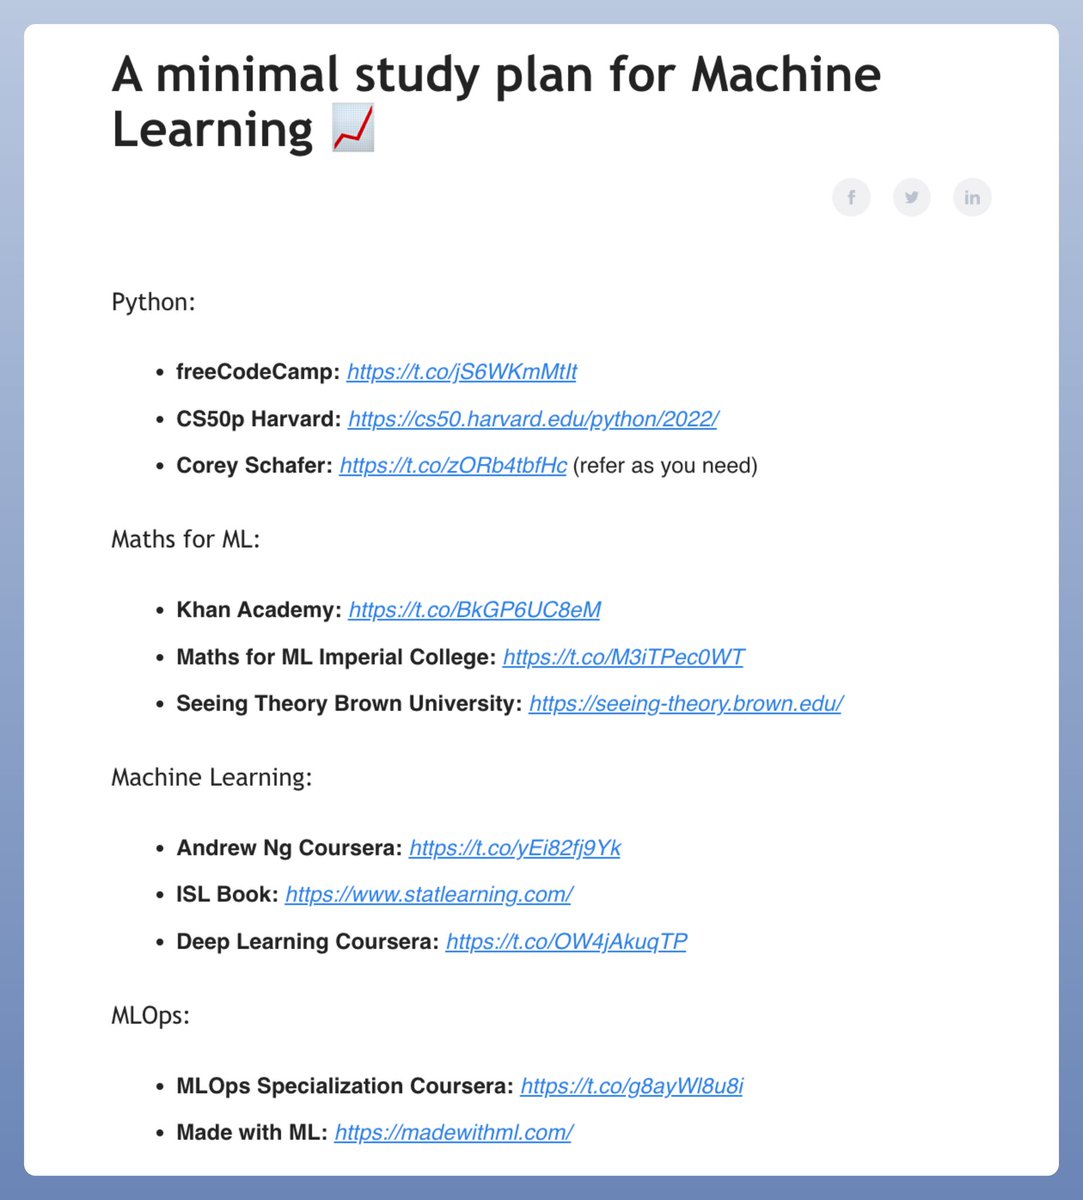
A minimal study plan for Machine Learning 📈
- Python
- Maths for ML
- Machine Learning
- Machine Learning Ops (MLOps)
(links in next tweet)
Check this out👇
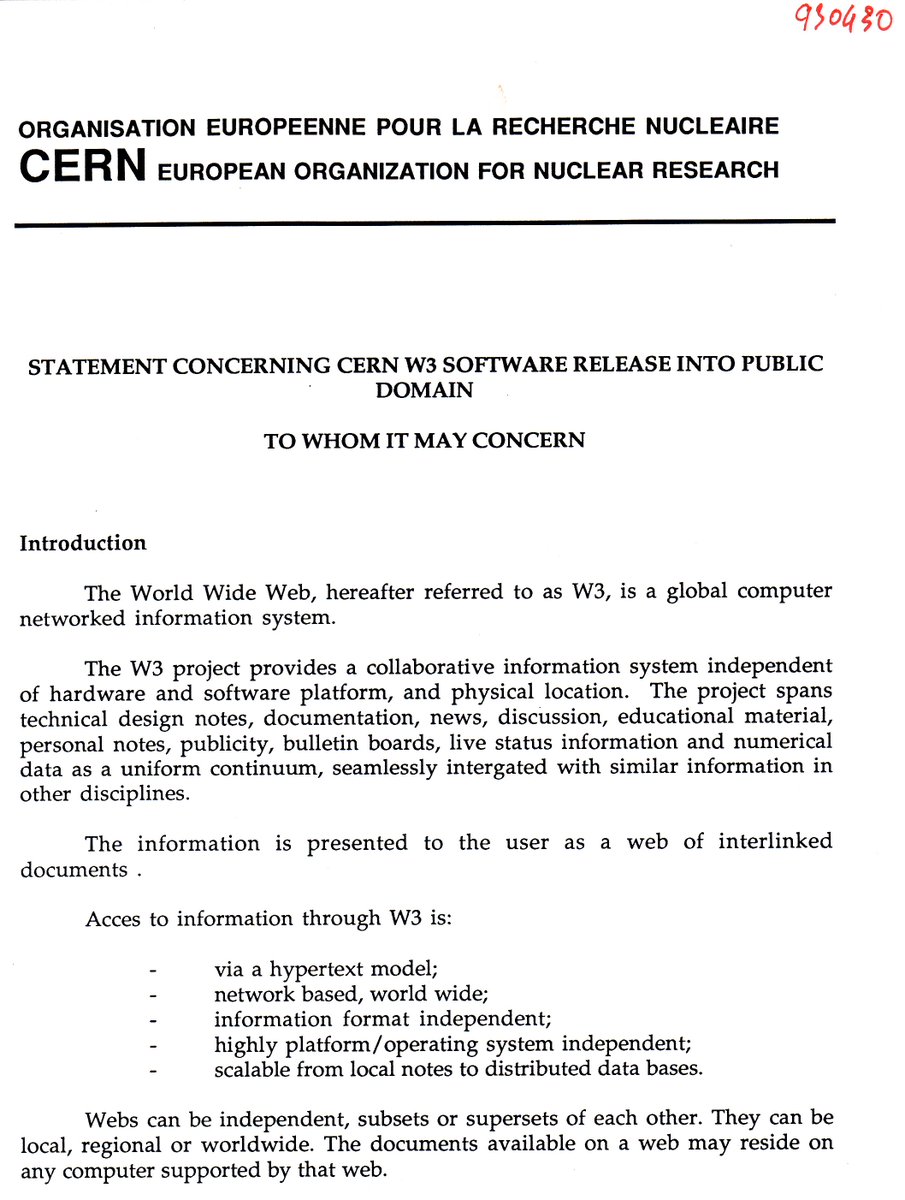
#OnThisDay in 1993, CERN put the World Wide Web in the public domain, later made available with an open licence, allowing the web to flourish.
Here we see Sir Tim Berners-Lee's proposal for the World Wide Web, revised back in May 1990.
The World Wide Web will be one of the topics of the next #CERN70 public event, “CERN – An extraordinary human endeavour”, where we will also talk about inclusiveness, collaboration, #OpenScience, #AI, machine learning and more.
📍CERN Science Gateway
📆 19 May, 17:00 – 19:00 CEST
Stay tuned to find out more about the event and our special guests. 😉
1/ Two decades ago, we revolutionized the #copyright system with our #openlicenses 🔓, creating a more permissive model of sharing that recalibrated the balance between creators' rights 👩🎨 & the public interest. But, our work isn’t finished...⤵️ #WorldIPDay#BetterSharing
Microsoft, GitHub y LinkedIn se han aliado para crear certificaciones que nos ayuden a encontrar los trabajos más demandados.
Los cursos están en español y son gratis hasta 2025!
→ Programación
→ IA
→ Ciberseguridad
→ Análisis de datos
https://t.co/7bbAkfy4On
Tableau Study Plan - 28 Days Timeline
Week 1: Introduction to Tableau
Day 1-3: Begin with the official Tableau Training Videos
Complete all the tutorials under “Creator”
Link: https://t.co/EL6suPlIOT
Day 4-7: Watch the "Tableau Tutorials for Beginners" series
Link: https://t.co/pUYdVY5xot
Week 2: Advanced Visualizations
Day 1-4: Explore advanced visualizations such as heat maps, tree maps, and box plots.
Link: https://t.co/Xz5tTjGoYt
Day 5-7: Watch tutorials on advanced Charts
Link: https://t.co/IBVhf1s4Q2
Week 3: Data Interactivity and Sharing
Day 1-7: Explore how to add interactivity to your visualizations, including filters and actions. Link: https://t.co/mIgjXAh2tf
Interactive Dashboard Demo: https://t.co/zG18JuFiJF
Sharing Dashboards Demo: https://t.co/MVkT01D7uL
Week 4: Guided Tableau Projects
Beginner Project: https://t.co/7auCYsTSDz
Project 2: https://t.co/tmxt81DvMM
Project 3: https://t.co/k1150ut2Ca
Additional Projects: https://t.co/yeB66iuXzk
Throughout your study plan, practice what you learn by working on personal projects or datasets related to your data science field.
📢 There's a new interface for the @wikidata demo system that makes it easier to interact w/ the #knowledgegraph. The interface is built w/ @metaphacts metaphactory on top of @OntotextGraphDB, & it's freely accessible to anyone!
Learn more: https://t.co/ivvp9SUA6j #linkeddata
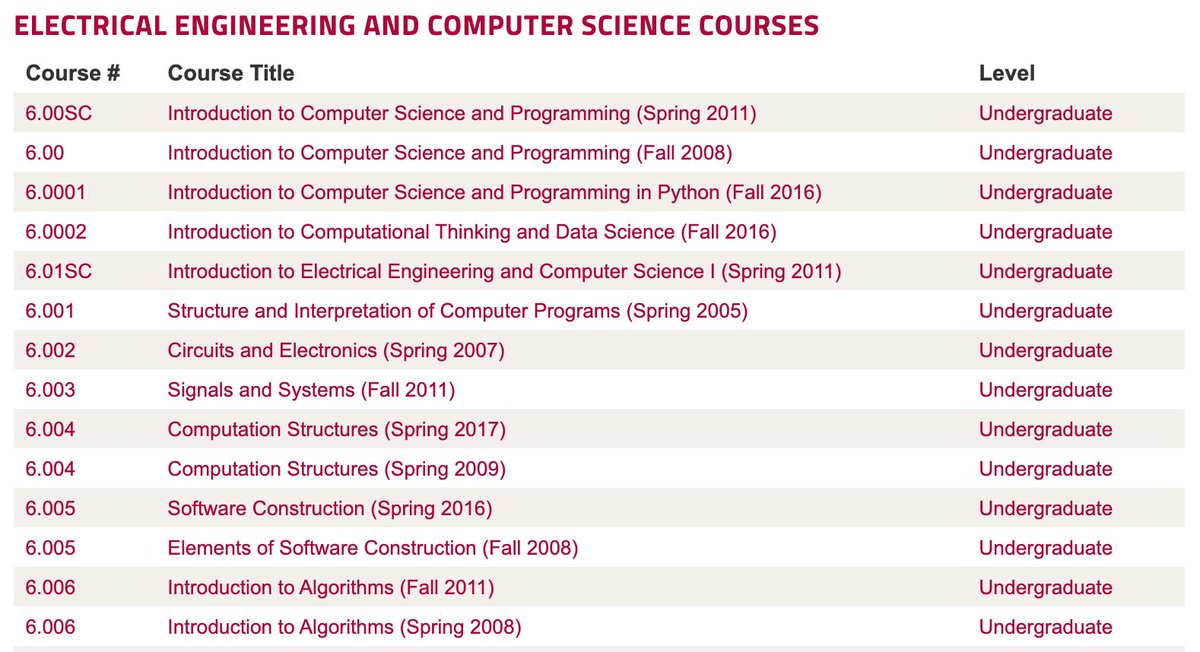
Free MIT videos & online materials from more than 2,400 courses, including intro classes in computer science, AI and algorithms.
Browse our open CS courses here: https://t.co/kkYgsyQOhz
(v/@MITOCW)
ELT differs from ETL solely in where the transformation takes place.
ETL and ELT are two common methods used by organizations to handle their data efficiently.
They stand for:
E - Extract:
This is the first step in both ETL and ELT.
It involves fetching data from various sources, such as databases, spreadsheets, websites, or applications.
T - Transform:
After the data is extracted, it often needs some cleaning and organizing.
This step is called data transformation.
Here, the data is structured and made consistent.
L - Load:
Once the data is extracted and transformed, it is loaded into a central storage place called a data warehouse or a database.
ETL
Extract, transform, and load (ETL) is a data pipeline used to collect data from various sources.
It then transforms the data according to business rules and loads the data into a destination data store.
The transformation work in ETL takes place in a specialized engine, and it often involves using staging tables to temporarily hold data as it is being transformed and ultimately loaded to its destination.
ELT
Extract, load, and transform (ELT) differs from ETL solely in where the transformation takes place.
In the ELT pipeline, the transformation occurs in the target data store.
Instead of using a separate transformation engine, the processing capabilities of the target data store are used to transform data.
This simplifies the architecture by removing the transformation engine from the pipeline.
---
That’s all for now!
- Smash the LIKE button and REPOST
- BOOKMARK because you’ll definitely want to revisit this again
- Follow me for more posts like this