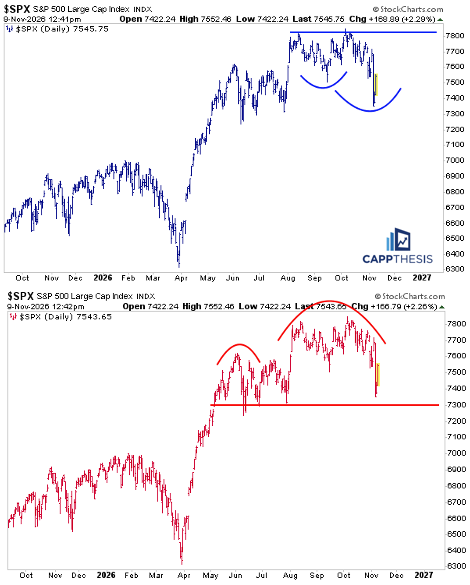
$SPX BOTTOM IS IN
Today's rally CONFIRMED the bullish WXY correction.
Next, I want this rally to extend a bit higher.
That should leave a new daily FVG behind.
A pullback into that FVG is the dip I'm buying.
New all-time highs come next.
It seems like everyone's celebrating the relief bounce, but $QQQ is heading straight into its biggest test yet...
declining 9EMA + 200day, all while still trapped inside last Thursday's nasty kill candle.
likely we chop around for a few days & frustrate both buyers + sellers.
this is insane.
everytime AI trade RSI hit this low as this week, it's the bottom(5 out of 6 times) or very near the bottom(1 out of 6);
covid crash didn't hit RSI this low...
$qqq $googl
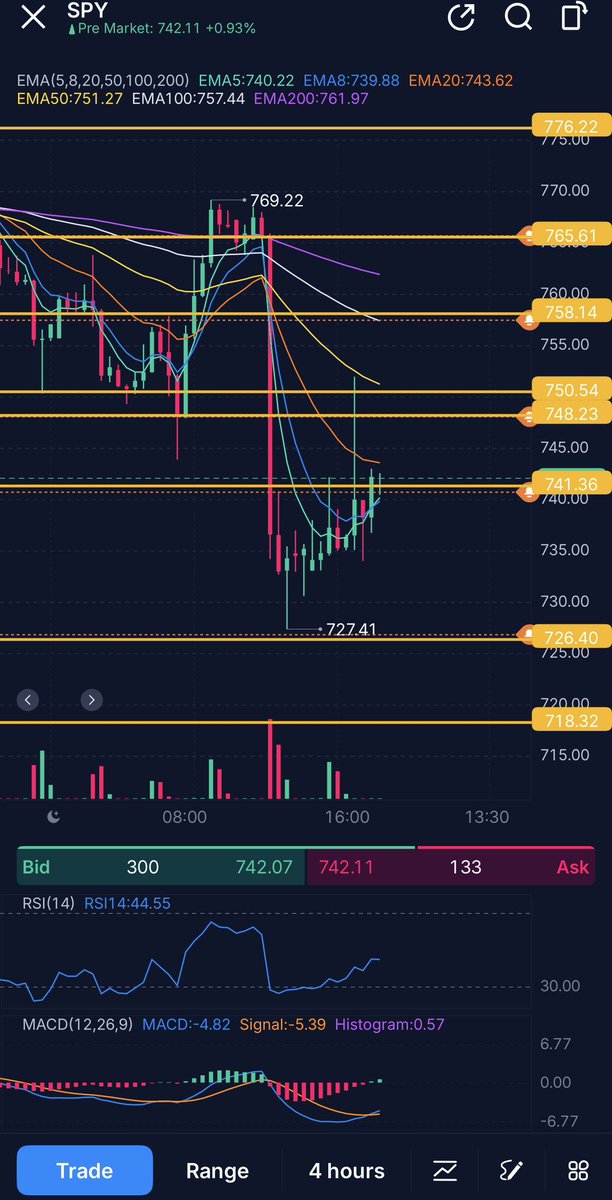
$SPY $QQQ Weekly Outlook: Is The Bottom In ? 9–13 November 2026
SPY is up on Monday’s premarket trading, approaching $741, while QQQ is also showing green.
After last week’s brutal selloff, a relief rally isn’t surprising. However, I remain sceptical that the bottom is in.
My base case is that this bounce eventually fades and SPY revisits its recent lows around $727, potentially making new lows before a more sustainable recovery begins.
The question isn’t necessarily whether we bounce. It’s where the bounce runs out of steam.
1. Three resistance zones I’m watching
$741: The first immediate resistance.
SPY struggled to reclaim this level throughout Friday’s session. A rejection here could send us back towards the recent lows relatively quickly.
$748–750: The next major resistance cluster.
If buyers push through $741, this is where I’d expect another meaningful test. A rejection here would reinforce my view that the rally is temporary.
$757–758: My upper resistance target if the bounce extends further.
This area is particularly important because it coincides with SPY’s 100day SMA and approximately its 20week SMA.
I wouldn’t be surprised to see a stronger relief rally towards this region before sellers regain control.
My preferred scenario is a rejection at one of these three zones, followed by another leg lower.
2. Where I expect SPY to go afterwards
My primary downside target remains $726–727, where we have the recent lows and the important 200day moving average support region.
I still believe those lows are likely to be retested, with a reasonable possibility of a liquidity sweep and fresh lows.
If $726 fails decisively, the next significant support I’m watching is around $718, near the 50week SMA.
That would be another important area to assess whether sellers are finally becoming exhausted.
I’m not necessarily calling for a bear market. I believe we’re experiencing a significant correction, and I still expect a meaningful recovery eventually.
But I don’t believe we’ve seen sufficient evidence that this correction has finished.
3. What would change my mind?
A sustained reclaim above $758 would make me reconsider the immediate bearish outlook.
However, for a convincing broader bullish recovery, I’d also want to see QQQ reclaim its 20week SMA around $712.
QQQ remains substantially below that level, which is a major concern.
I’ve been highlighting this warning for weeks: QQQ lost its 20week SMA before SPY, and I warned that SPY could eventually follow, triggering a deeper correction.
That’s exactly what happened.
Until both indices repair their weekly technical structures, or test lower liquidity levels, I’m not rushing to declare the correction over or predict new all time highs.
4. Economic calendar ET
Tuesday, 10 November: October CPI and Core CPI 8:30 AM.
Thursday, 12 November: Weekly Jobless Claims 8:30 AM. Existing Home Sales 10 AM.
Friday, 13 November: October PPI and Core PPI 8:30 AM.
CPI and PPI are particularly important. Either release could significantly influence the direction of this week’s trading, especially given the market’s sensitivity to inflation and Fed expectations.
NVIDIA reports next Tuesday, 17 November, not this week. Its earnings will be especially important for semiconductor and AI sentiment following the recent sell off.
Bottom line
I’m treating the current green premarket action as a potential dead cat bounce until proven otherwise.
$741 → $748–750 → $757–758: My resistance roadmap.
$726–727: Primary downside target and potential liquidity sweep.
$718: Next major support if the recent lows fail.
A sustained reclaim above $758 would challenge my near term bearish thesis, but QQQ must also repair its weekly structure before I’d become confident about a broader bullish reversal.
I still favour another test of the lows, possibly new lows, before the market establishes a more convincing bottom.
I don’t trust this rally yet.
$SPX | $QQQ | $SMH — The damage is in black and white
SPX: 4 consecutive weekly lower lows.
QQQ: 4 consecutive weekly lower lows.
SMH: 5 consecutive weekly lower lows.
Take a deep breath and look at the bigger picture.
There's nothing new here. Stretches of 4–5 consecutive weekly lower lows are a recurring feature of market corrections.
We've seen them before, and we'll see them again.
I've marked the key Fibonacci retracement zones on QQQ and SMH.
A bounce can happen anytime. That doesn't mean the correction is over.
Price decides. Not headlines.
$SPY
AI Bubble has officially burst today IMHO.
Semiconductors are the pick and shovel suppliers to the AI buildout. The industry is down 32% from the parabolic peak in June.
Today it took out the July low with authority. The AI bubble has technically burst. There will be rallies and hope but the process has begun. Financial reflexivity that propelled it up is now in reverse. Credit markets were the canary.
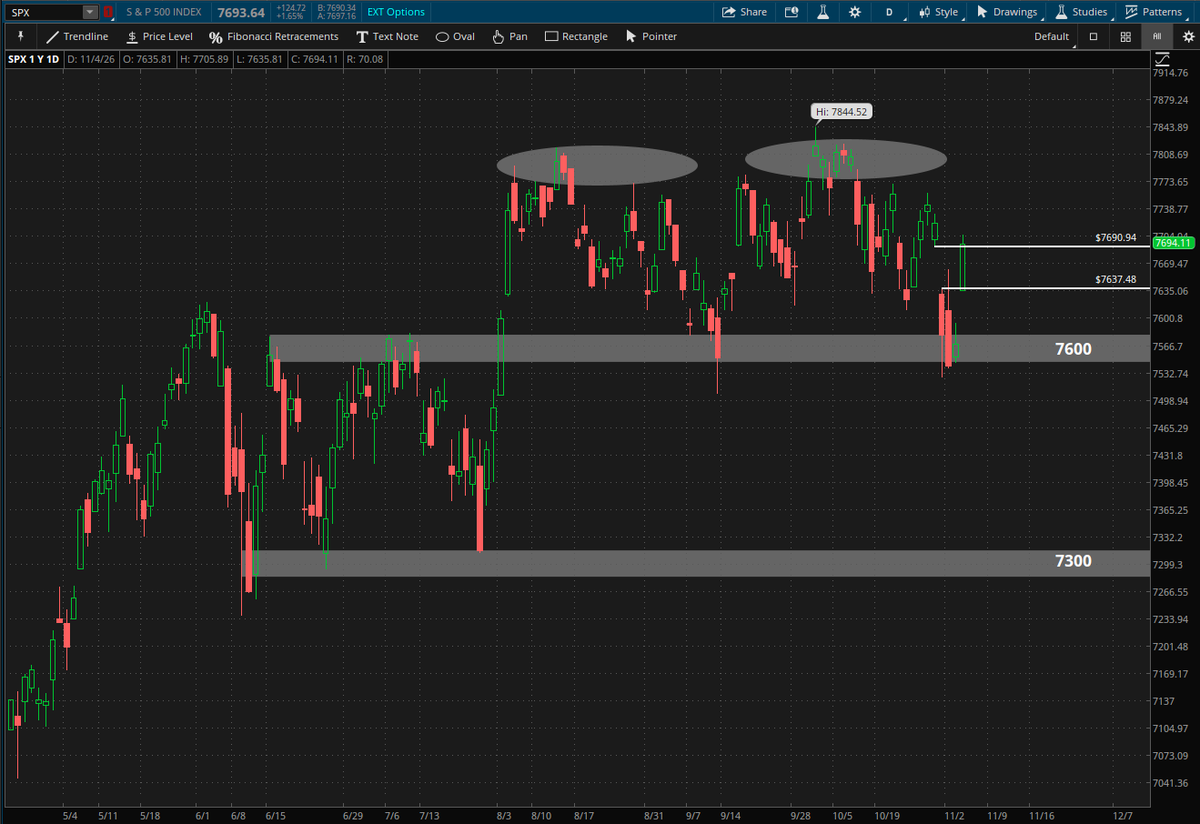
Chart of the day: #SPX
Exhaustion gaps: Gaps that are filled within a few bars and may signal the end of an existing trend.
*Schwab does not recommend the use of technical analysis as a sole means of investment research
*All names and market data shown below are for illustrative purposes only and are not a recommendation, offer to sell, or a solicitation of an offer to buy any security
*Chart source: thinkorswim
Speaking of the dot com bust… We all know the caveat that price analogs are silly and for entertainment purposes only. Yet, the analog between the AI melt-up since April 2025 and the dot com bubble from October 1998 until March 2000 keeps rhyming with uncanny precision. It’s bound to break at some point, but for now both the time dimension and the price magnitude have been identical, just in time for the negative headlines to start around neocloud credit spreads and capex plans.
X silver bulls
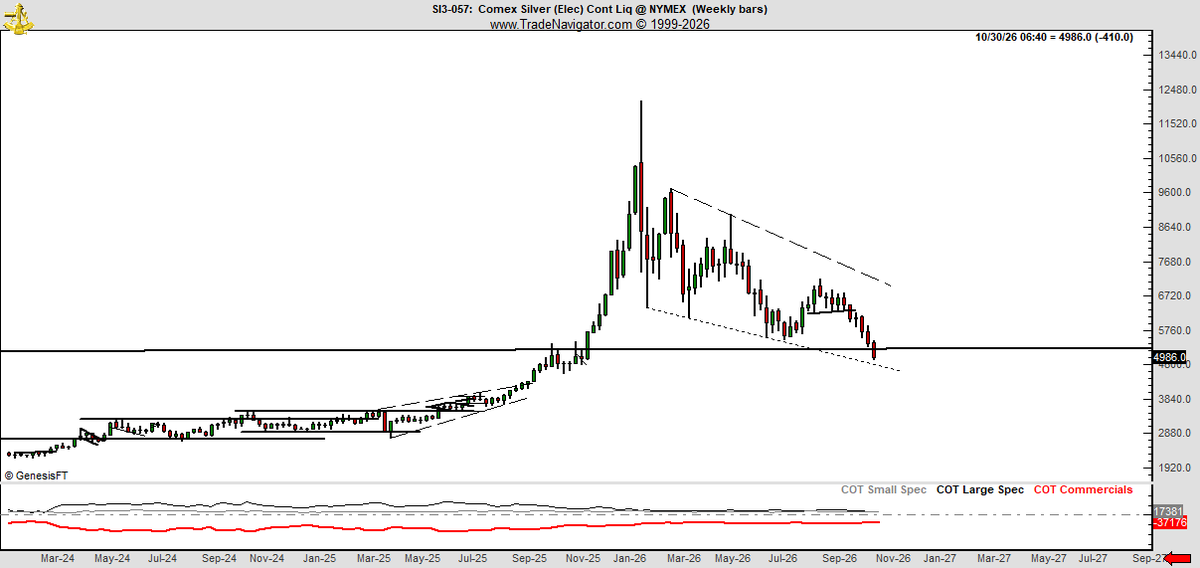
I've drawn this chart in a couple of ways -- weekly line and daily candles
All evidence points to a falling wedge at this time with final low slightly below 50-year support
Remember, prices after escaping a falling wedge typically roll out -- they do not burst out (Schabacker, Edwards/Magee)
But the current outlook is for sharply higher prices in the years ahead however we get there $SI_F
I was hoping for low $40s but not likely to get under wedge interpretation
I am a Bayesian. This means that at any one moment I will have bullish, bearish and neutral price perspectives whose probabilities change as conditions change.
Yes, I could imagine turning my Bitcoin $BTC for Eurocurrency $EURUSD
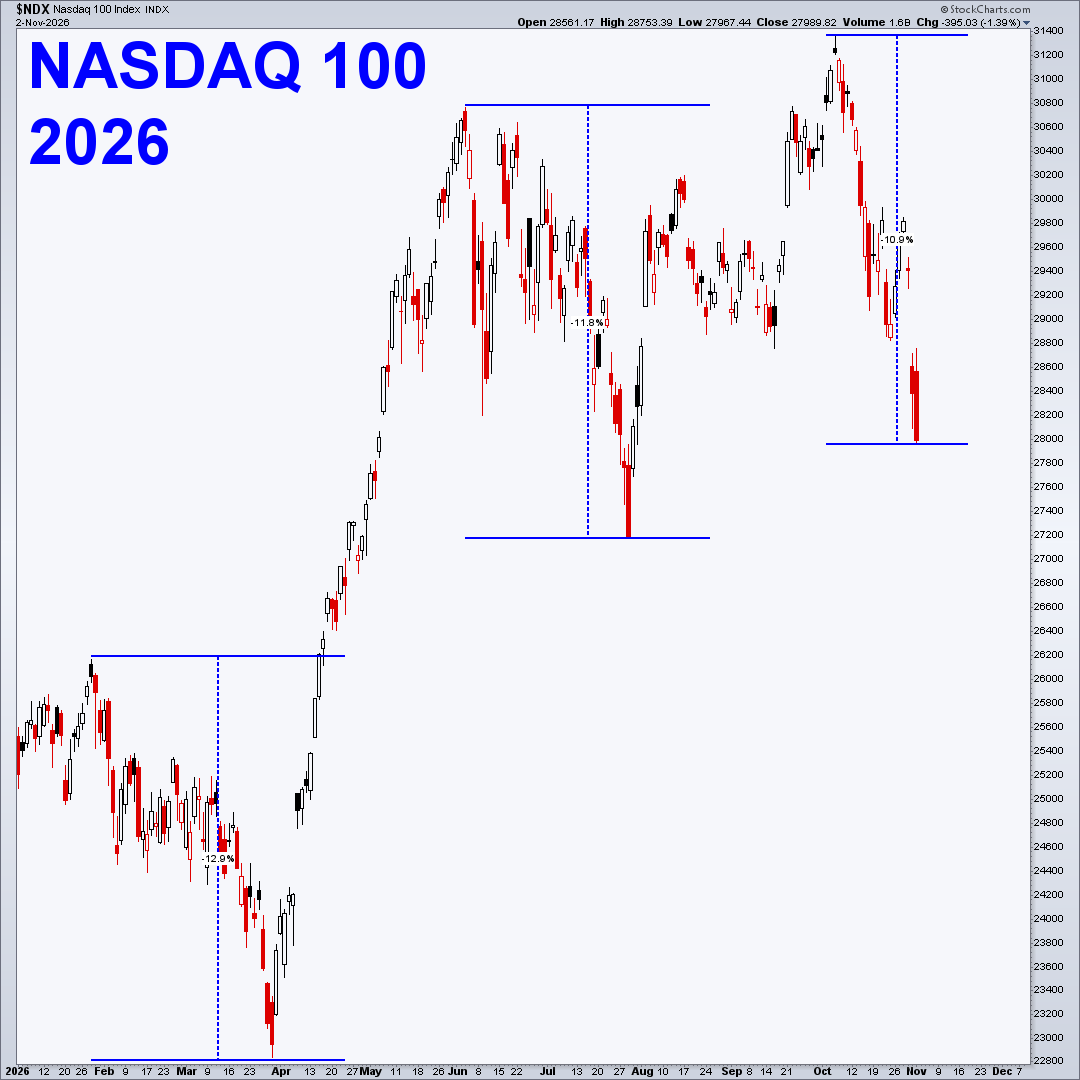
The Nasdaq-100 just logged its 3rd 10%+ correction from an all-time high this year.
🔻 −12.8%
🔻 −11.7%
🔻 −10.8% (and counting)
Since 1985, this has only happened in 4 other years. Here’s how each one played out 🧵
We've finally made it to November... holy crap October was brutal.
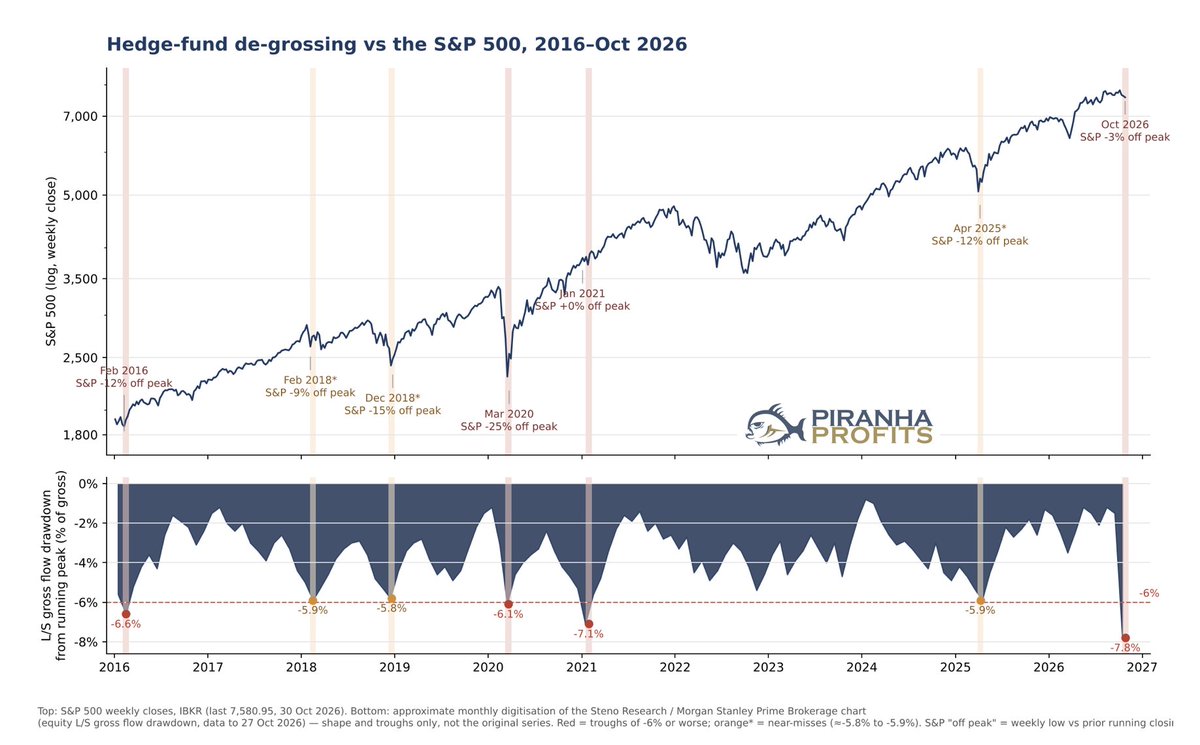
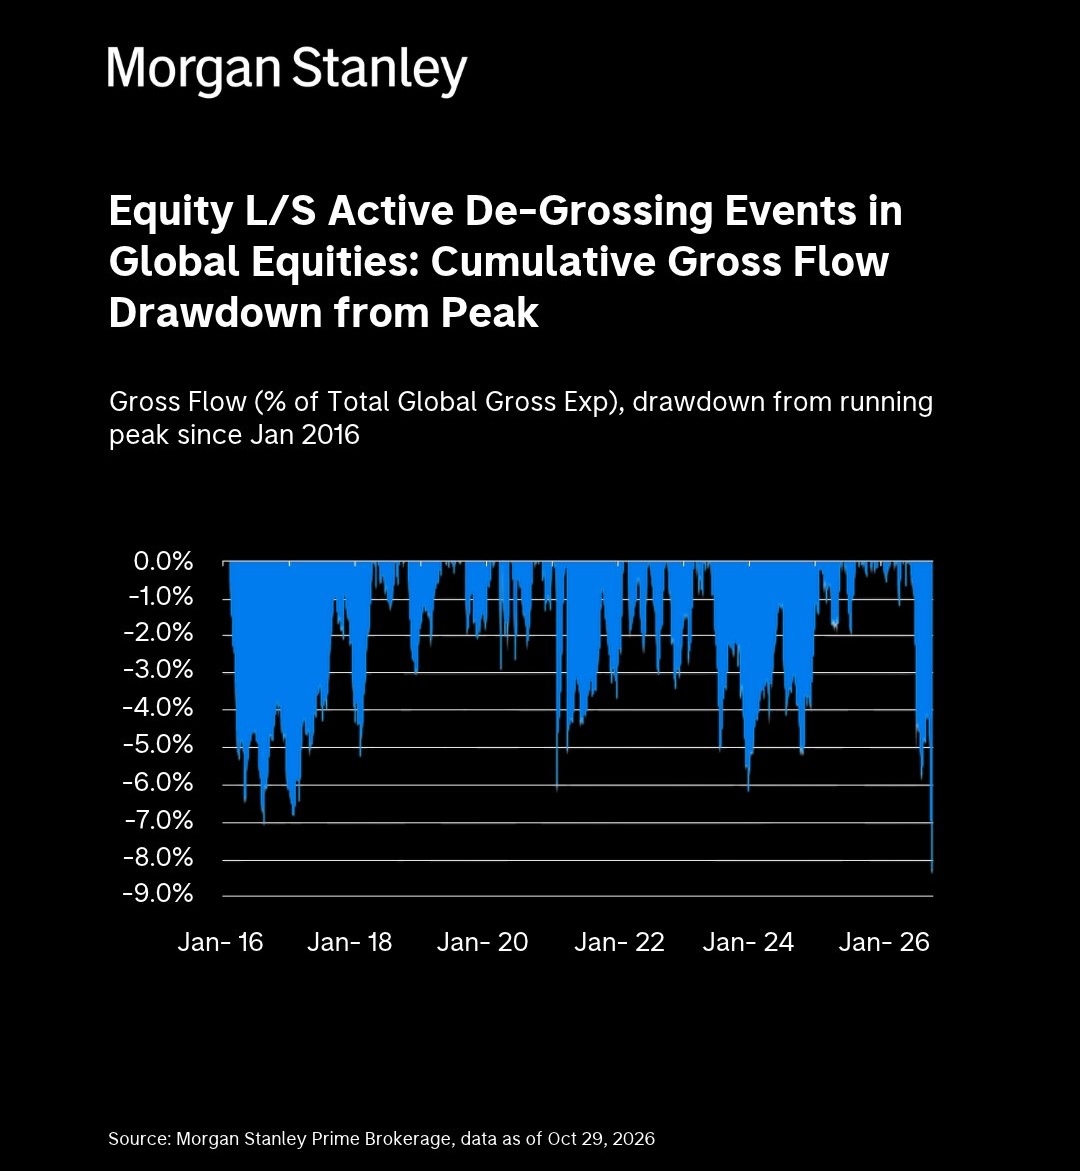
Per Morgan Stanley data, the recent hedge fund de-grossing was the highest in the past 10 years.
Exceeding the:
- 2016 Chinese stock market crash
- 2018 Volmageddon
- March 2020 COVID crash
- 2021 Archegos collapse / Evergrande crisis
- 2022 bear market
Goldman's prime brokerage desk reported on the 26th that it had also seen ~$20B of selling over 2 weeks vs. $23 billion during July's entire unwind.
From $HOOD short interest data, from Sept -> Oct short float also increased from:
$AAOI: 12.5% -> 19.84%+
$AEVA: 11% -> 25.64%+
$CBRS: 12.25% -> 20.12%+
$AEHR: 14.33% -> 17.93%+
$TSEM: 2.15% -> 4.73%+
$CIFR: 19.94% -> 25.39%+
$LWLG: 15.24% ->19.12%+
$OKLO: 17.72% ->22.93%+
$CRWV: 17.91% ->26.58%+
Substantial deleveraging coinciding with surging short interest, kinda looks like a July setup after Midterms?
The recent rotation also kinda pushed names like $CRWD and cybersecurity to bubble valuations into hundreds of fwd P/E...
Earnings on many AI capex + bottlenecks (not all like $INTC) looked strong:
eg. $AXTI guided annualized Q4 = 23.7x P/E now, not including potential InP substrate hikes + capacity expansion that can compress it to single digits.
- $SKHY (~$59B operating profit) casually making more than trillion dollar companies like Amazon ($28.1B operating profit), backed with 5Y LTAs.
- No signs of $MSFT / $AMZN materially cutting capex, while $SPCX secures $40B more for GPU procurement.
Slightly painful, but I think the AI capex trade (specifically photonics/memory) is a generational opportunity, with extreme volatility in between.
Don't overthink what stocks to buy
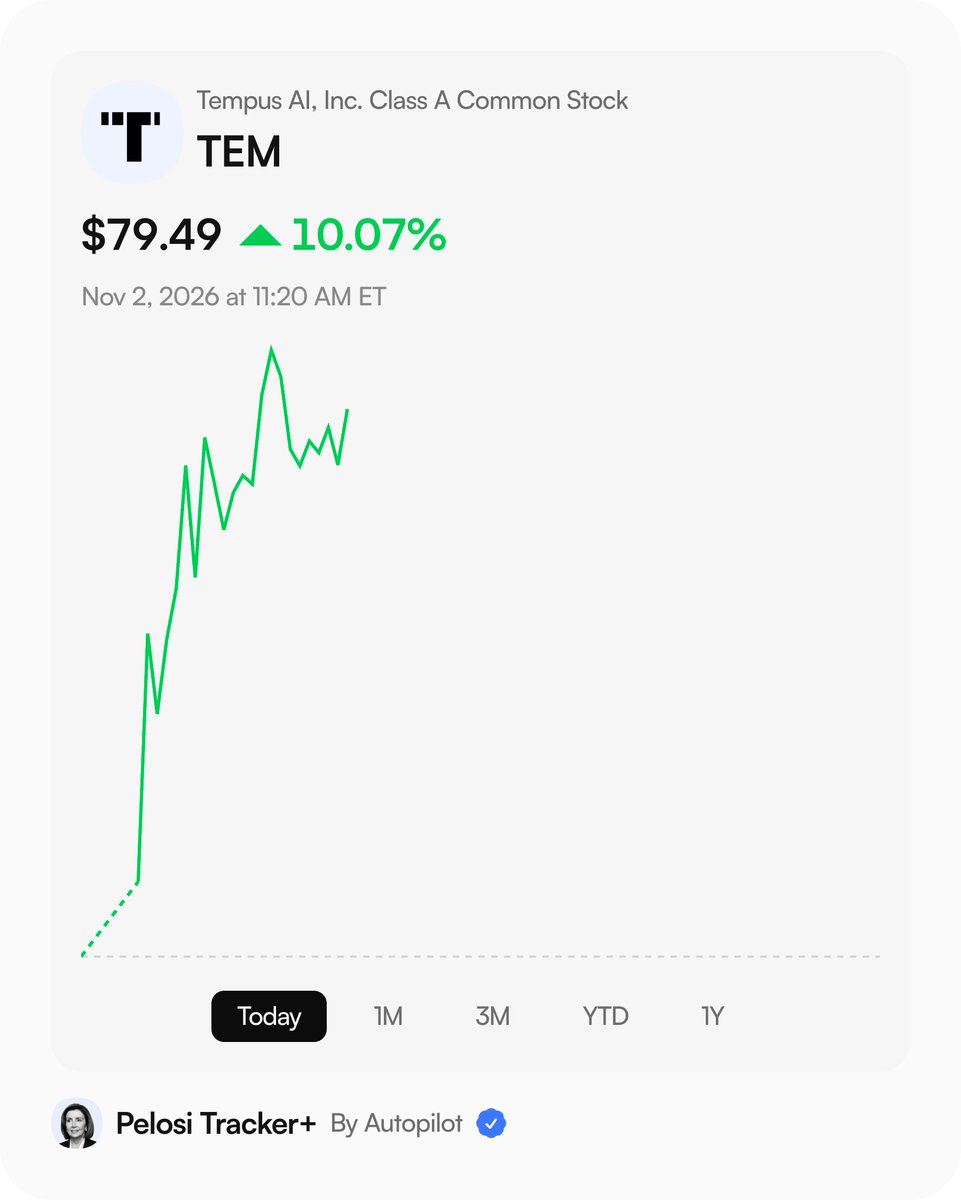
Remember when Pelosi's $TEM position crashed 60%?
- Pelosi bought $TEM calls in Jan 2025 when it was $31
- It ran to $103
- Then crashed to $41
- Today it's up 10% after beating earnings
She exercised her options and still holds 5,000 shares per disclosures
Good food, warm moments, and a grateful heart❤️
Sometimes, the best part of the day is simply slowing down, enjoying a delicious meal, and appreciating the little things in life
Wishing everyone a beautiful and peaceful night! ✨
Silver
I've seen many such purges over past 50 years. In this case, caused by those long over $90-$100 who claimed they would never sell. but they are now selling and saying they will never buy Silver again
This is how the start of bottoms are formed
Hedge funds just hit the panic button harder than at any time in the last ten years. Here is why that is good news for you.
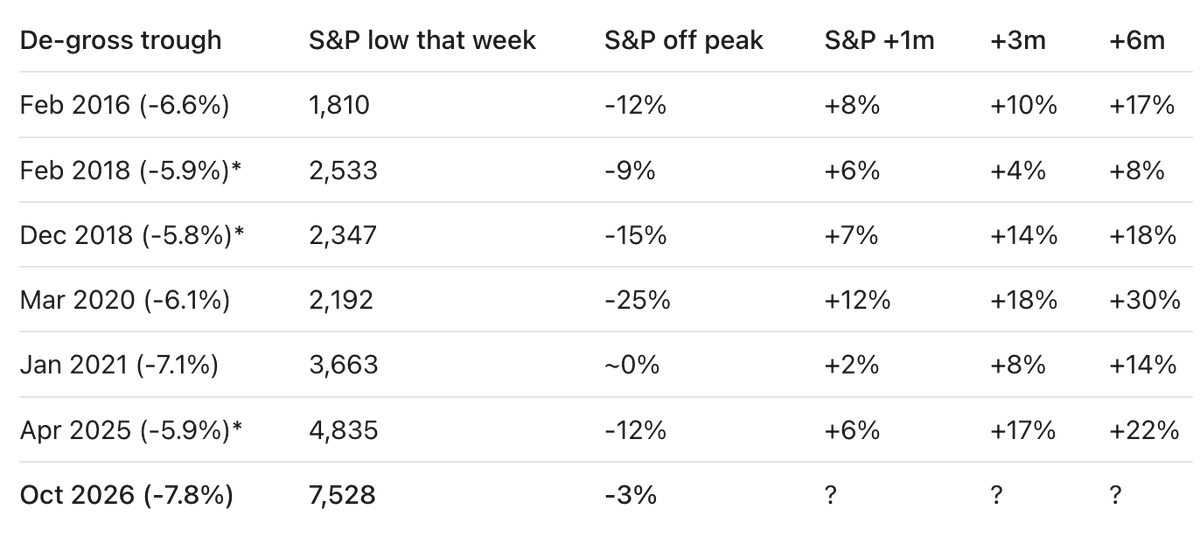
Morgan Stanley tracks the total money its hedge fund clients have bet on stocks. When that total drops sharply, it means funds are being forced to cut positions, usually because their losses hit a limit. In the last 2 days, it fell 7.8%, a bigger unwind than the Covid crash, the GameStop squeeze, or the 2016 and 2018 selloffs.
Every time this number fell past 6% (2016, 2018 twice, 2020, 2021, 2025), the S&P 500 bottomed within a week or two and was higher one, three and six months later. Six out of six.
The reason is simple. Once the forced sellers have sold, there is nobody left to push prices down. Those same funds then have to buy back in, and that buying has powered every rebound in the table.
As for me, I am looking for great businesses that got dumped for no reason. That is where the bargains are.
Despite claims that the precious metals bubble has burst, the evidence shows that gold and silver remain historically undervalued and the biggest gains still lie ahead.
Learn more in my latest report:
https://t.co/kMUdi3ZedT
$SLV $GLD