I'm pleased to announce that I have been recognized by Forbes as one of the "Top Next-Gen Wealth Advisors Best-in-State" for Tennessee for 2023. More about the award can be found in the link below: https://t.co/GsUTX8zMjx
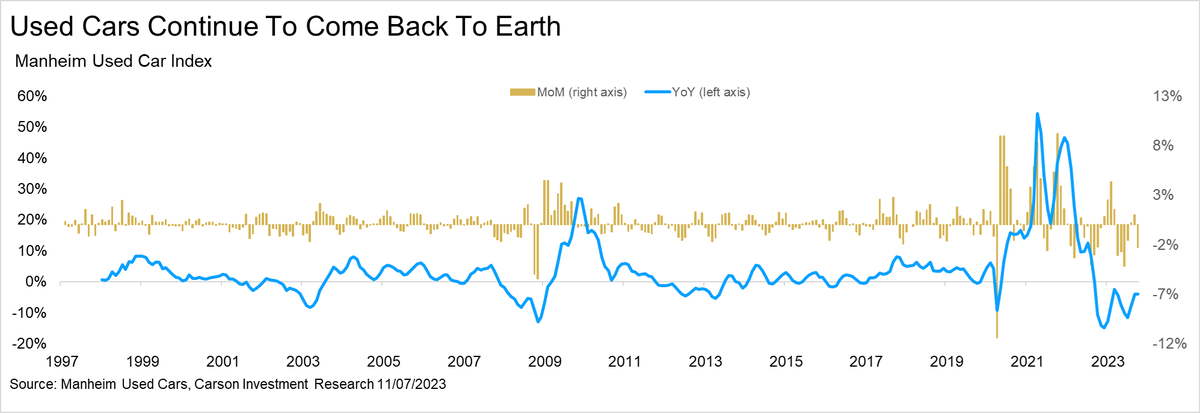
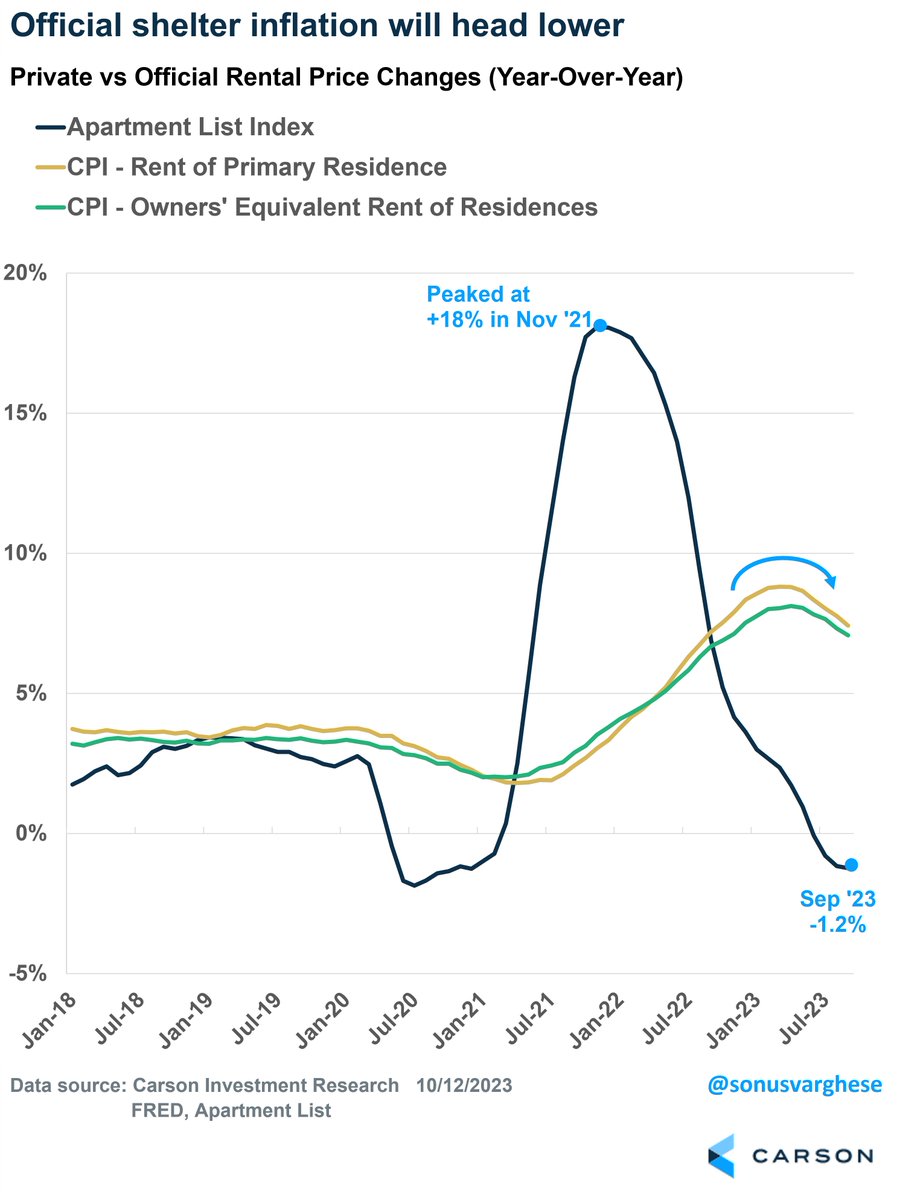
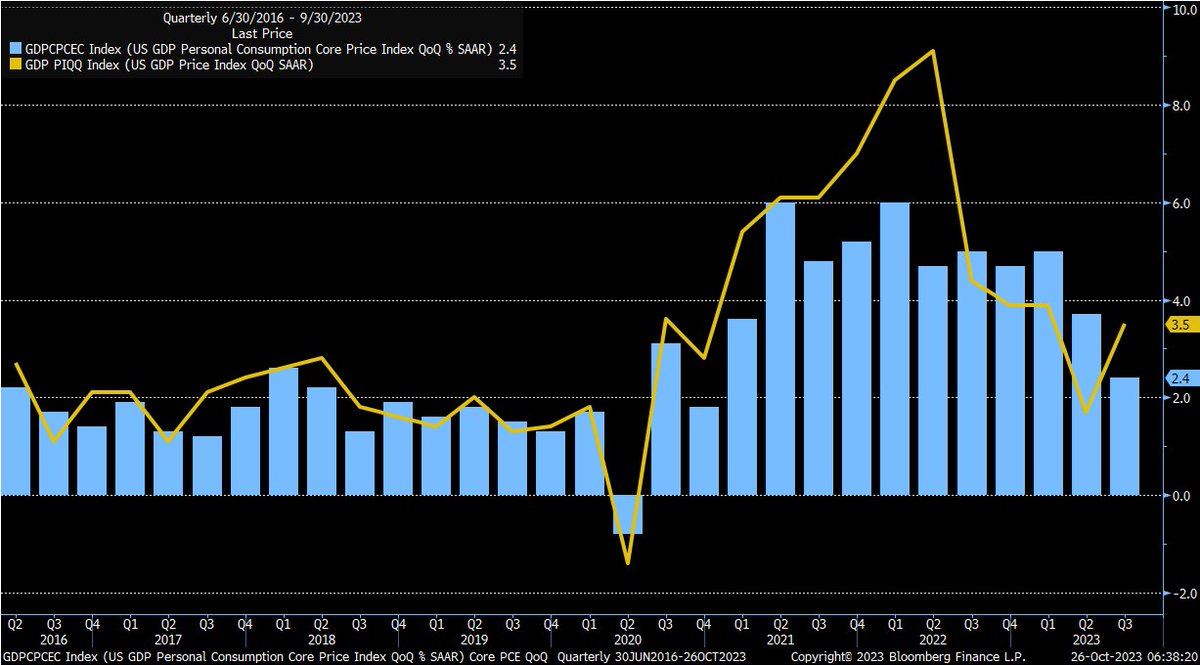
Housing and used cars make up more than half of core CPI.
Rent prices are negative YoY (Apartment List) and used cars (Manheim) have been negative YoY for 14 months.
I know what Powell said today, but the Fed is done hiking.
An update to this chart: the inverse correlation remains intact. In September, the dollar is up strong. As a result, the US stock market has been weak.
The recent Zweig Breadth Thrust has been pretty widely reported.
But a side note: 2nd signals that occurred within 18 months of previous signal have done even better than the average.
Here’s hoping that history repeats. @sentimentrader
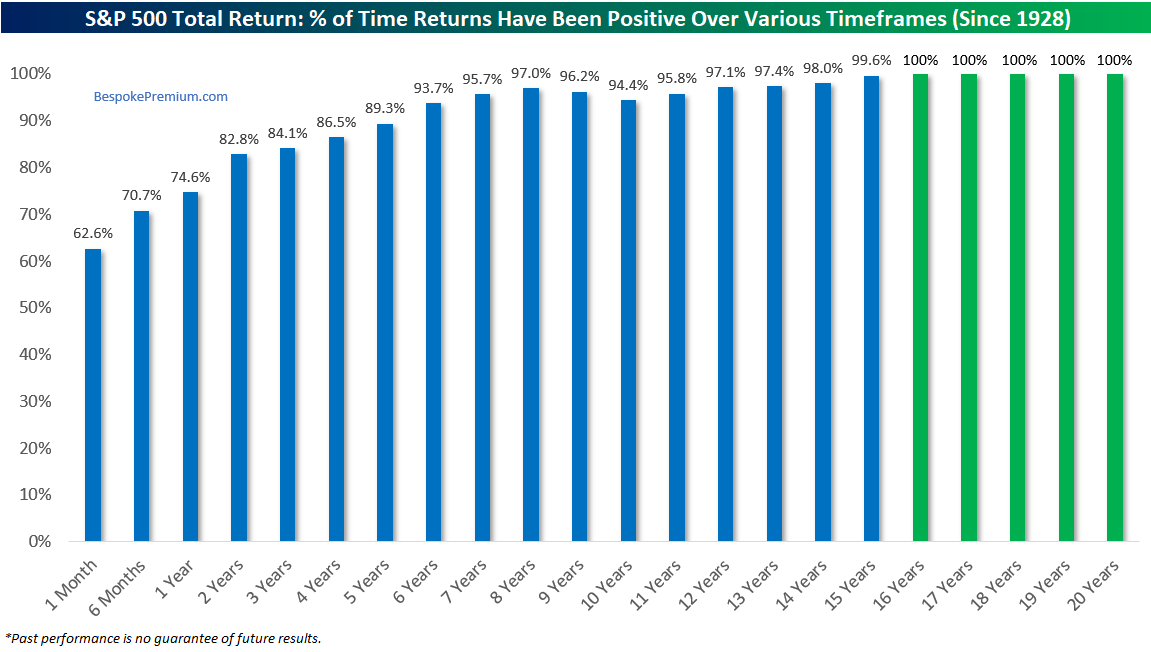
Keep this in mind: It's about time IN the market, not TIMING the market. Since 1928, S&P total returns have been positive 97% of the time across all 8-year periods. Historically, the stock market has given investors odds that "beat the house" over a long enough time frame.
Your financial advisor cannot guarantee you a profit. At the same time, you cannot guarantee yourself a profit. What is certain is that your financial advisor (for the most part), can help you keep your own emotions from hurting you. So, don’t blame them for a bear market.
“Attempting to short-term swings in individual stocks, the stock market, or the economy, is not likely to produce consistently good results.”- Lou Simpson
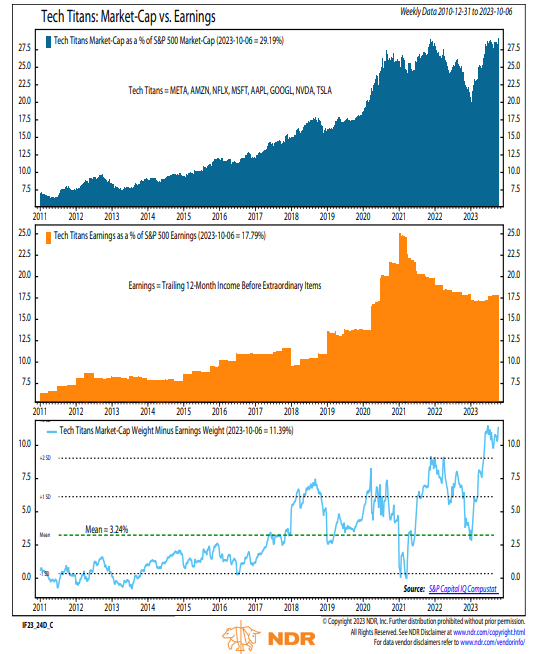
This week's earnings remind me of a great chart from @_rob_anderson. @NDR_Research Tech Titans account for 29% of $SPX market cap & 18% of earnings. 11% gap is near a record. Tech has to report great EPS to justify the rally they've already had let alone outperform going forward.
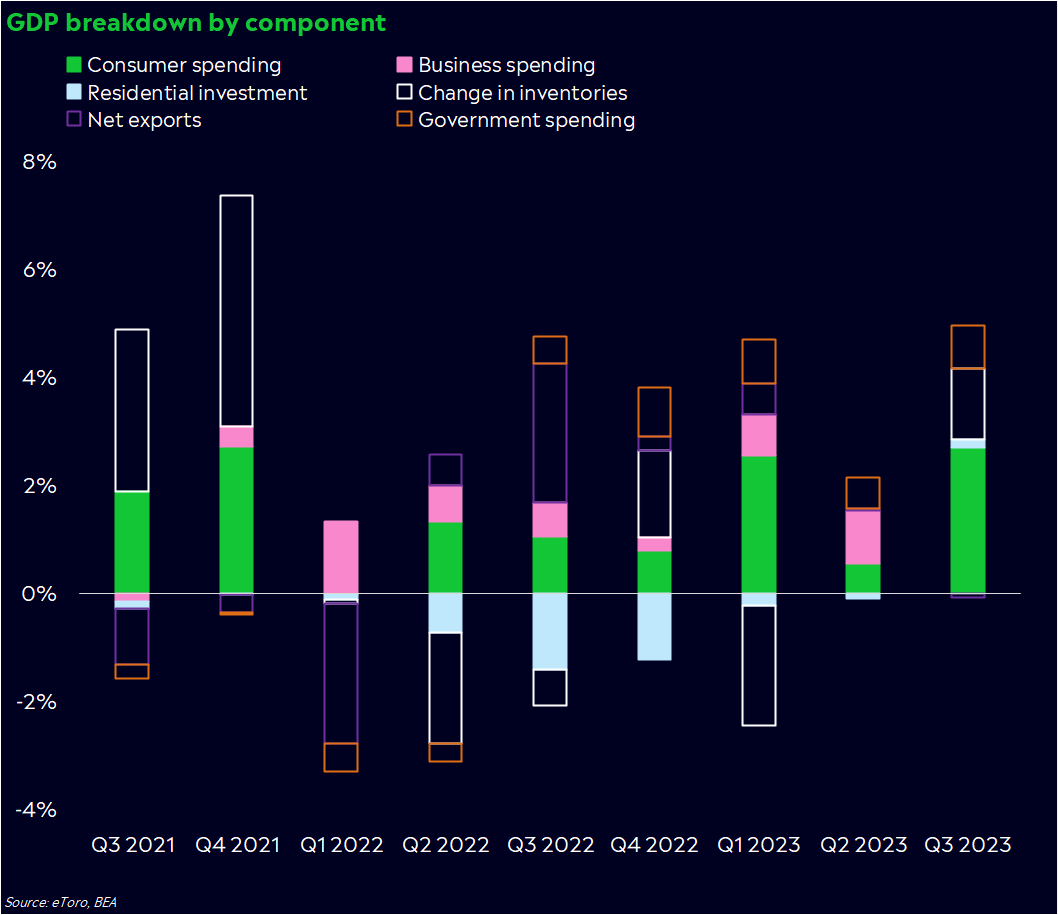
Q3 GDP 4.9% vs 3.8%
Durable goods 4.7% vs 1.9%
Initial claims 210k ==> still historically low
There continues to be very little chance of a recession with when the economy is this strong.
🤯THE Q3 US GDP REPORT🤯
🔥 Strongest economic growth (outside of 2020-2021) in nine years
🛒Consumer spending was the primary driver
🏡Housing market investment is finally adding to growth
😤The US economy is in absolute sicko mode
AAII Sentiment Survey:
*Bearish: At its highest level in nearly six months; unusually high
*Bullish: Right at the bottom of its typical range
*Neutral: Below average for 4th week
https://t.co/CPRW7Qb6JE
Nice reminder from @SamRo that earnings drive stock prices, esp. long term. And the need to look at NTM data.
From 12/31/19 to 10/20/23 -
S&P 500 TR: +39%
Of which ...
Dividends: +7%
Earnings: +37%
Multiples: -5%
https://t.co/RRnKORtVD7
While LEI looks like carp, CEI is the only thing that matters to the NBER with regards to #recession labeling.
Lot of green, lot of green...
$SPX $SPY $QQQ $Macro #economy
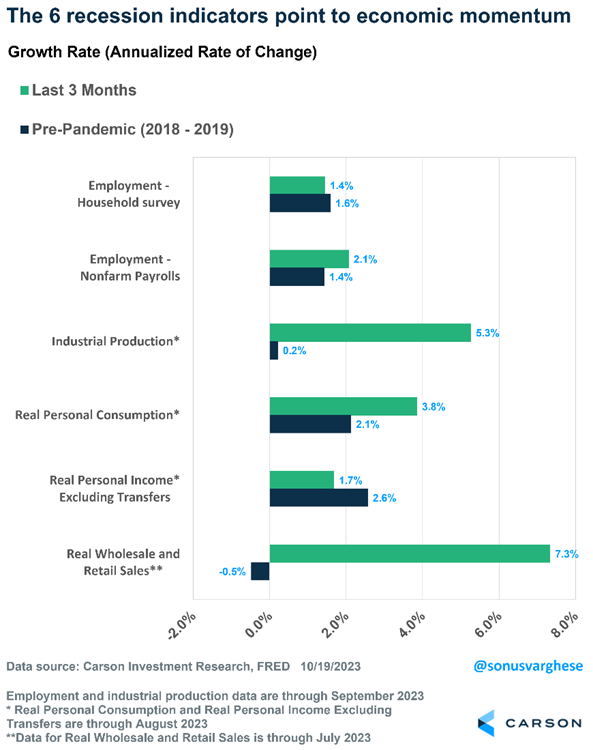
NBER looks at 6 indicators to determine if we are in a recession or not.
Short answer is there's absolutely no recession now or in the near future.
Very strong industrial production, consumption, and wholesale/retail sales the past 3 months leading the way.
🇺🇸 S&P 500
The low percentage of US stocks trading above their 50-day moving averages, a contrarian indicator for oversold conditions, may indicate a potential rally in the S&P 500
👉 https://t.co/yIk7SZYp6p
h/t @BofAML#markets#sp500 $spx #spx#stocks#stockmarket#equities
Remember all the talk the past few months about excess savings running out?
Turns out, the data was off and now there's an extra $1 trillion in excess savings we didn't know about last week.
Guess we missed all the updated articles, huh?