👉🏿@Geordie_Greig your obituary of David Hockney in the @Independent is by far the best. You captured the essence of the man, of the artist, his joie de vivre, his indomitable and mischievous character, his irreverence. It is a tribute of love from someone who had the privileged to know him. I loved your quote:
"He outshone art professors with better insight, knowledge and eloquence. He was funny and self-aware...He just wanted art and not for any horizons to be limited".
Is Europe falling behind the US on productivity? The Krugman vs Aghion–Bergeaud–Garicano debate hinges on one choice: current vs constant PPPs. A new note maps the gap behind it — all 27 EU states, two data sources — and what it does and doesn't settle. 🧵
CHART OF THE DAY: On Apr 16, the IEA made a headline-grabbing warning: Europe had "maybe 6 weeks or so of jet fuel left." It's week seven; the planes are still flying. Since those headlines, European wholesale jet fuel prices have fallen ~30% to a ~3-month low.
Hard to know where to start. But let's start by pointing out that the US and the EU don't run a giant cross-border progressive income taxation and redistribution program, while Ohio and California do.** It's called the US federal government. So when the US grows faster than Belgium, the Belgians don't benefit from that directly through government-run redistribution between the US and Belgium, whereas the Ohioans do when California grows faster. So it's natural for Belgians to be more worried about falling behind than Ohioans. Also, ambitious Ohioans can always move to California.
There is more of course. Capital flows across state lines are much larger than those between countries. So, there is a lot more market-driven risk sharing between US states than across borders as well.
**You could call it a government-run risk-sharing program if you prefer.
In der ganzen Causa konnte man im Schnelldurchlauf beobachten, wie es diesem Land ergeht, wenn man die Entscheidungsgewalt einer lauten Minderheit aus Verschwörungstheoretikern, Influencern und TikTok-Süchtigen in die Hand gibt.
As other economists have shown, Gabriel Zucman's tax and inequality data is wildly misleading. He turns seemingly every methodological dial to claim that inequality has soared and high-earner taxes have collapsed.
In his own data, virtually the ENTIRE drop in high-income taxes come from Zucman's highly unorthodox assumptions about the incidence of the corporate tax - which he claims cost the top 1% of earners 29% (!) of their income in 1951, and yet now costs them 6%.
And this questionable data accounts for his ENTIRE claimed "drop" in higher-earner taxes.
You see - on the income tax side - Zucman's own data shows that the average individual income tax paid by the rich has RISEN - not fallen - since the 1950s.
See https://t.co/7MV77qBWUe then click on "Table 2: Distributional series," and navigate to tab TG2b, column T for income taxes (and column U for corporate taxes)
As much as Zucman builds up 1950s income tax rates, almost no one actually paid 91% tax rates - or even touched a tax bracket over 50%. And that's why actual income tax revenues - including income tax rates paid by the rich - were *lower* in the 1950s than today.
Zucman's rhetoric is peddling a "tax the rich" utopia of the 1940s-1960s that his own data shows did not exist.
We stopped everything to write an answer (link below) to Paul Krugman's two posts of today (one informal, one with a simple model) arguing that Europe is broadly not falling behind the United States.
The change measured by the Draghi report, he argues, is mostly due to growth in the technology industry, which has distorted GDP numbers without actually leading to higher standards of living. We should believe our eyes when we walk around France and walk around Mississippi.
Krugman is wrong. The measures he uses understate European stagnation. This matters enormously. Divergence with the United States is the strongest evidence for reform in Europe.
1. The growth numbers
Krugman compares the United States, France, and Germany at purchasing power parity in current prices. On that measure, France's and Germany's position relative to America has been roughly constant since 2000.
But current price comparisons miss productivity gains in sectors where prices fall. If America produces twice as much software while the price of each unit halves, the value of American software output looks unchanged even though the volume has doubled.
Most economists therefore use constant prices, which fix the base-year PPP level and apply each country's real output growth on top of it. American output growth has concentrated in tech, where prices have fallen tremendously as productivity rises. In terms of the volume of things produced, America has pulled away from Europe.
2. Is it all the tech industry?
Krugman concedes this tech divergence but says it is not welfare-relevant. The American growth lead is an accounting artefact of measuring more iPhones at base-year prices, not a sign that Americans are actually richer, because Europeans buy the same iPhones at the same world prices.
This is not the right way to think about the world today, as an earlier Paul Krugman would have argued.
His model assumes tradable goods, interchangeable workers, marginal-cost pricing, and no profits. Each assumption fails.
Most of what households buy is non-tradable: housing, healthcare, childcare, education. When American tech firms bid workers from haircutting to coding, American haircut wages rise. Germany has no growing tech sector to do the bidding, so German wages stay flat.
Technology is not priced at marginal cost. Apple's margins are around 40 percent. Anthropic's inference margins are at 70 percent. The major platforms enjoy network effects, switching costs, and lock-in that hold prices well above what a competitive market would deliver. A large share of the productivity gains in technology stays as profit.
A lot of the value of American technology dominance shows up in equity, not in wages. Apple, Microsoft, Nvidia, Alphabet, Meta, and Amazon together are worth $21 trillion, more than the entire combined stock market value of all European stock markets. Around 60 percent of US equity is held by American households. The median French or Spanish household holds almost no equity.
The median employee at Meta, a company with almost 80,000 employees, earned $388,000 in 2025.
This advantage is not going to go away. Krugman's own 1991 paper, cited in his Nobel prize, showed that comparative advantage in modern industries is produced by increasing returns to scale, specialized labor markets, supplier networks and the agglomeration of suppliers, workers, and ideas in particular places. Once an industry concentrates somewhere, the concentration is self-reinforcing. Europe is being pushed away from the next round of technology industries (AI!).
3. What about inequality?
Another retort is that GDP per capita hides substantial inequality, and so even if America is rich on average, this is mostly due to the super wealthy.
But despite the US's high pre-tax income inequality, it also achieves higher median incomes than Europe, in part because of such a high base, and in part because it actually redistributes more than many European countries.
The cleanest comparison is median equivalised disposable household income: income after cash taxes and transfers, adjusted for household size and purchasing power. According to the OECD's 2021 numbers, the median American earns 30 percent more than the median Dutchman, about 31 percent more than the median German, and about 52 percent more than the median Frenchman.
4. What about hours worked?
Krugman points out that while American GDP per person is higher, most of this is because Americans work more. For this divergence to be an hours worked story, Americans must work more relative to Europeans now than they did in 2000.
The opposite has happened. Birinci, Karabarbounis, and See in a 2026 NBER paper show that about half of the American-European hours gap that existed in the 1990s has reversed by the end of the 2010s. Americans work fewer hours per person than they did in 2000, while most Europeans work more.
5. Is America not a bad place to live?
Walk around Alabama and France: surely the former cannot be substantially richer than the latter?
American cities often have poorer centres and richer suburbs or exurbs. European cities preserve richer and more attractive historic cores. A visit to a city as a tourist in America compared with a city in France will leave one having seen different spots on the income distribution. Americans in Europe go to the nicest and richest European cities.
Rather than a walking around test, do a driving around test. Go to the periphery of any modern American city and see a level of new-built material wealth that is extremely uncommon in Europe, with thousands of enormous four- or five-bedroom homes. In the South, in places like Nashville and Austin, drive around the downtowns to see hundreds of luxury apartment buildings springing from the ground. This construction boom is replicated virtually nowhere in Europe today.
The other question is generational. Housing often costs more in Europe than in the United States, despite the quality of the housing stock generally being much better. Europe has nice city cores but these are inaccessible to young Europeans.
Consider the salaries available to entry-level workers. The starting pay for a London police officer is $57,000. In Washington, DC, $75,000. The entry-level Deloitte consultant job in Madrid pays around €28,000, roughly $33,000 per year. In Charlotte, the entry-level Deloitte job pays $63,000.
There are many things to dislike about life in America. But relative to 25 years ago, the gap in material wealth has shifted dramatically in America's favor.
https://t.co/VOpQ32R5tg
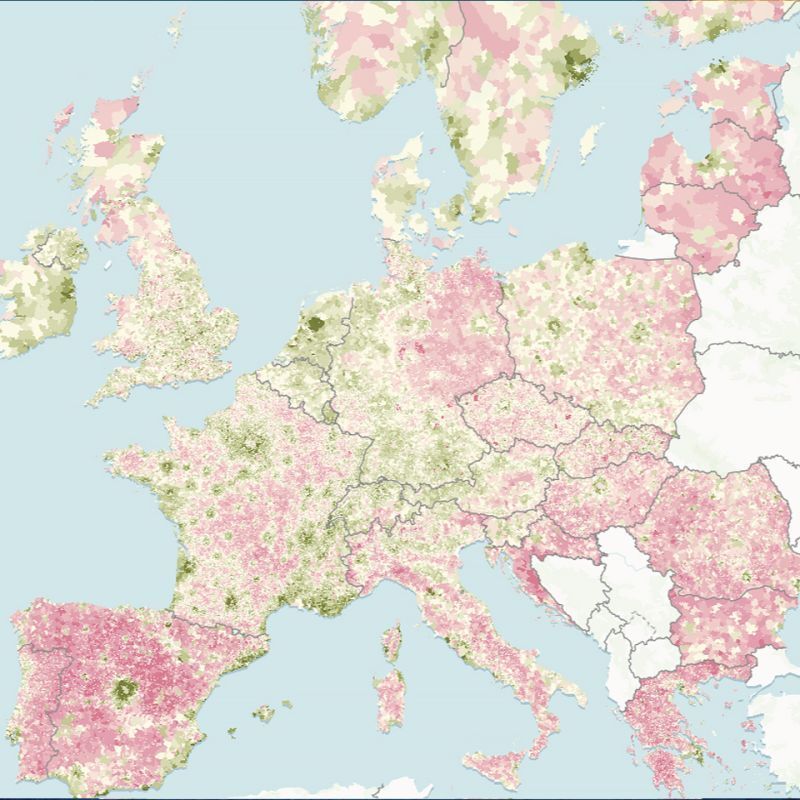
It's hard to oversell this map - make sure to bookmark it and share it with your friends. Fantastic research that must have been soooo labour intensive: How has the population of evert single small geographic region across Europe changed from 1961 to 2024? You will want to study this map in detail. Source (keep scrolling for a while): https://t.co/2akdcsaBpm
the 9-Euro Ticket increased train trips by about 35%, but reduced car traffic by only 1–5%, implying limited car-to-rail substitution. The additional train demand worsened rail service quality: the share of delayed trains rose by 30%, with spillovers to long-distance trains.
Very interesting work.
My perspective: LLMs can't possibly answer that question because there are unknown unknowns.
And it's not just because we don't know the technological trajectory of LLMs. It's because we have under-appreciated the economic and sociological foundation of work. And how that mediates AI use.
We are living in a world where you can ask a model to generate a 10-page artifact that appears highly plausible. Then you spend a week or even a month trying to validate all the details. In the end, you realize that while you've gained insights and even new knowledge, the real conceptual work has already been done by yourself, not the model. If you fail to notice this subtle fact, that's when you begin to embrace a YOLO mindset and the allure of "beautiful AI drift". I am deeply concerned about our psychology of discovery. It is becoming far too easy to drift away from the traditional conceptual loop and start believing in the abundance of endlessly generated wisdom.
✍🏾 I attempted to collect my initial thoughts from a week long infrastructure tour of The Netherlands. Here are some quick takeaways. More to come!
Links ⏬⏬⏬
Today, the @OpenAI Economic Research released a new framework for thinking about AI and the labor market led by our labor economist @Alex_M_Richmond.
One of the most common questions I get as Chief Economist is: which jobs are most exposed to AI?
That’s a useful starting point, but it doesn’t tell you where labor-market pressure may show up first.
okay I guess I have to talk about Péter Magyar here.
Let me just start with saying, in a very unladylike way, that you guys seem to have zero clue what happened in Hungary in the last two years, you completely miss the point, and you're a disappointing bunch.
Let's go.
An increasingly coherent picture of the impact of AI on jobs, by @jburnmurdoch@ft:
1. New Fed paper by Crane and Soto now confirms with official labor force survey data what private payroll analysis was showing: roughly 500,000 fewer coders are working than pre-LLM trends would predict.
2. Argues evidence consistent with my work (with Lin and Wu, link in my pinned post) on weak/strong bundles: junior developers and contractors hold "weak bundles" (their work is mostly standalone coding that AI can substitute directly), senior developers hold "tight bundles" where coding is combined with domain expertise, judgment, and cross-functional responsibilities, making substitution much harder.
3. Freund & Mann and Gans & Goldfarb add a second lens: what matters is the value of the tasks that survive automation. Remove coding from a senior role and you free up time for higher-value work; remove it from a junior role and almost nothing remains.
https://t.co/uqkcvtxfvg