In my opinion, this is the most compelling chart for being a stock market investor.
Over the last 50 years:
-US Inflation: up 6x
-US Treasury Bills: up 8x
-S&P 500 total return: up 271x
Over the long run, stocks trounce inflation and protect your purchasing power.
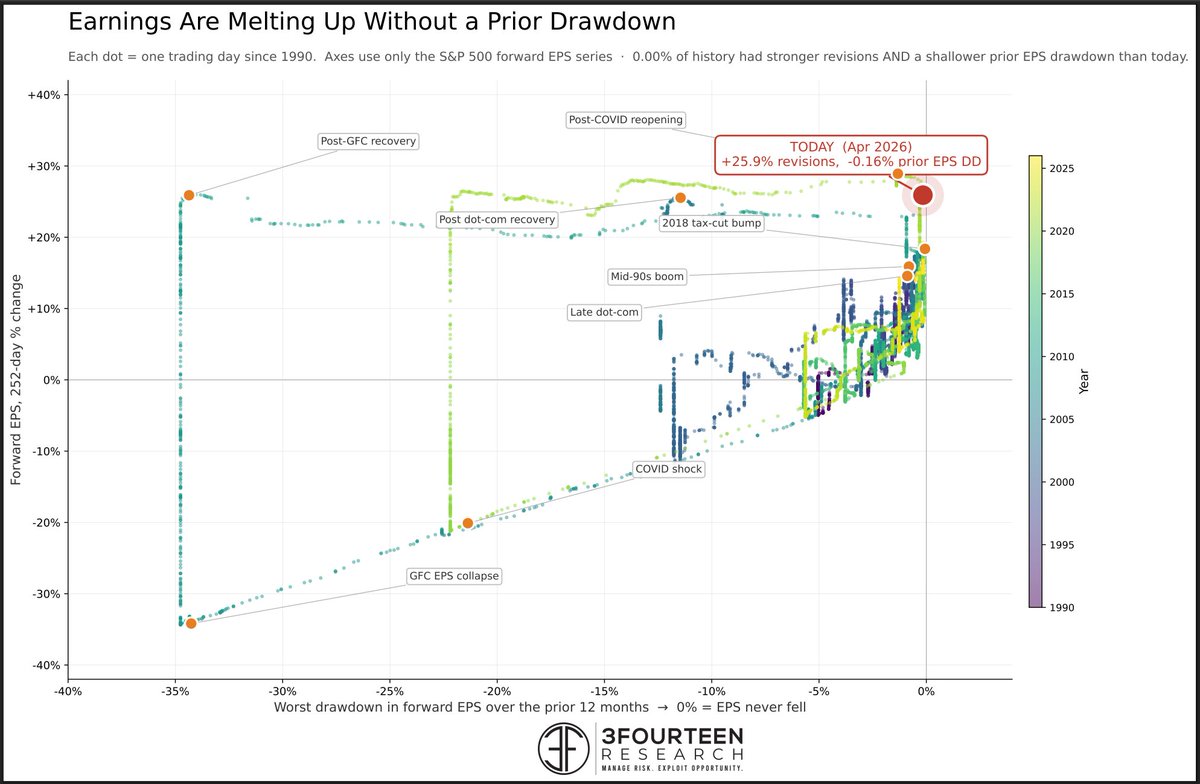
Earnings boom really accelerating.
Forward estimates now up >25% YOY.
Passing through the first part of Q1 reporting, forward estimates are leveling up.
Updated chart below...Unprecedented.
@StockSavvyShay@fiscal_ai I'm a shareholder. Out of favor. Inflationary environment, investors want cash flow, and return of capital now not in 10 years
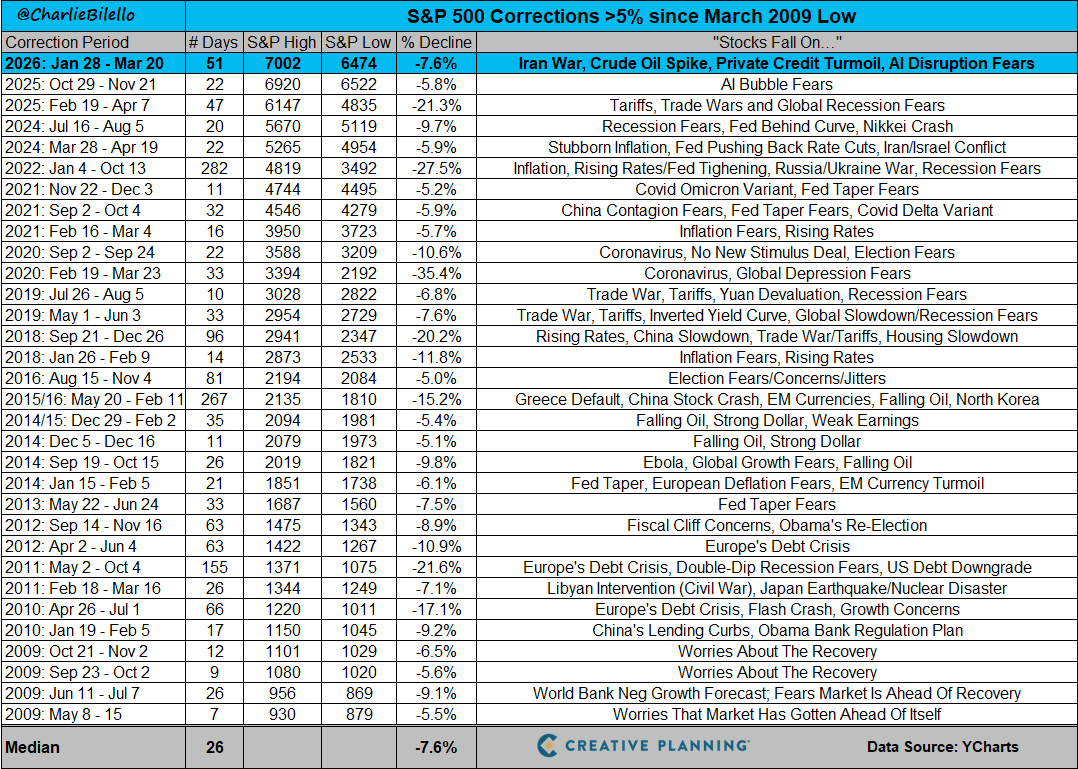
The S&P 500 is now down 7.6% from its January peak.
Is that a lot? Not at all.
This is right in line with the median correction off an all-time high since the March 2009 low.
We see a decline of this amount or more during most calendar years. That's the price of admission.
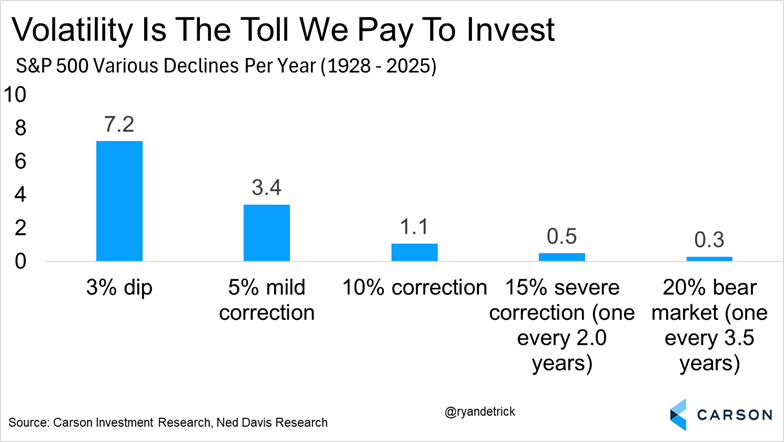
The S&P 500 is in the midst of the first 5% mild correction since November (-5.1%).
We tend to see three of these a year on average. They aren't fun, but they are a necessary part to investing.
@aakashgupta If I create my own index, as you suggest, won't I be subject to taxation every time I rebalance? If so, the ETF structure has major tax advantages
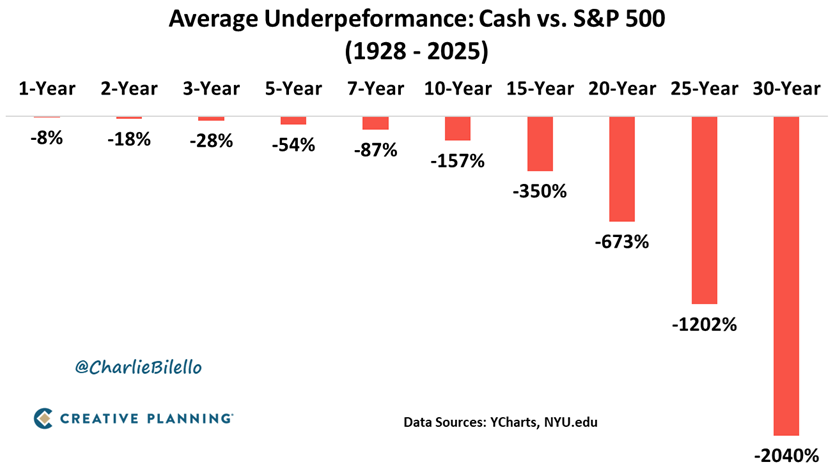
Sitting in cash is the opposite of investing, and invites long-term, dramatic underperformance. Holding cash is basically begging the Fed and Congress to light your money on fire via inflation.
A PICTURE WORTH A THOUSAND WORDS.
Team USA honored Johnny Gaudreau by bringing his 2 kids out to the ice and holding his jersey up for a picture after winning the God Medal.
Johnny and his brother Matthew were killed by a drunk driver in 2024, which kept him off the ice today.
What an incredible tribute that his family will never forget.
This is BIGGER THAN HOCKEY.
More stocks on the New York Stock Exchange hit new 52-week highs today than at any point since 2024. The NYSE Advance-Decline Line closed at an all-time high. The Dow Jones Industrial Avg and the equally weighted S&P500 both finished at fresh record highs. What else do you want?
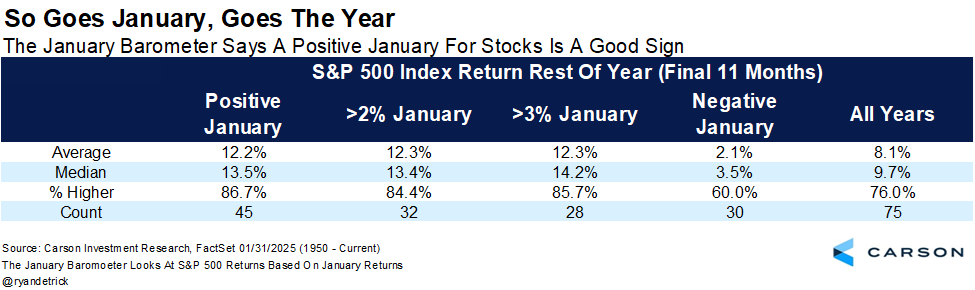
"So goes January, so goes the year."
History shows that when the S&P 500 finishes January in the green, the next 11 months are higher 86.7% of the time with an average return of 12.2%. 🚀
Check out the "January Barometer" stats below. Is the bull market just getting started?
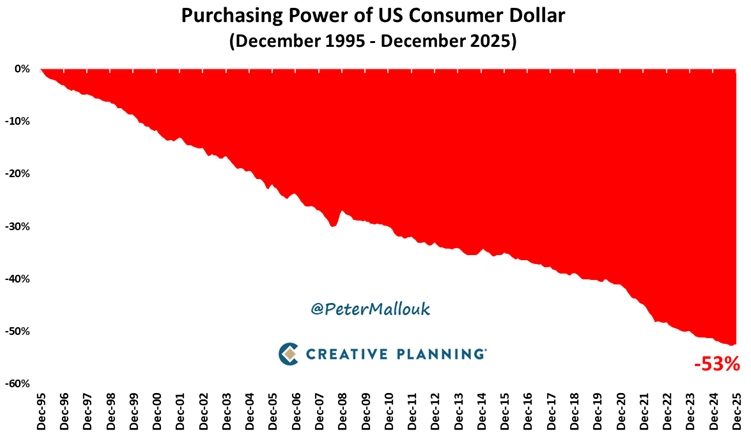
Over the past 30 years, the U.S. dollar lost 53% of its purchasing power.
That’s the hidden cost of sitting in cash due to inflation.
Keep what you need for an emergency in cash and invest the rest.