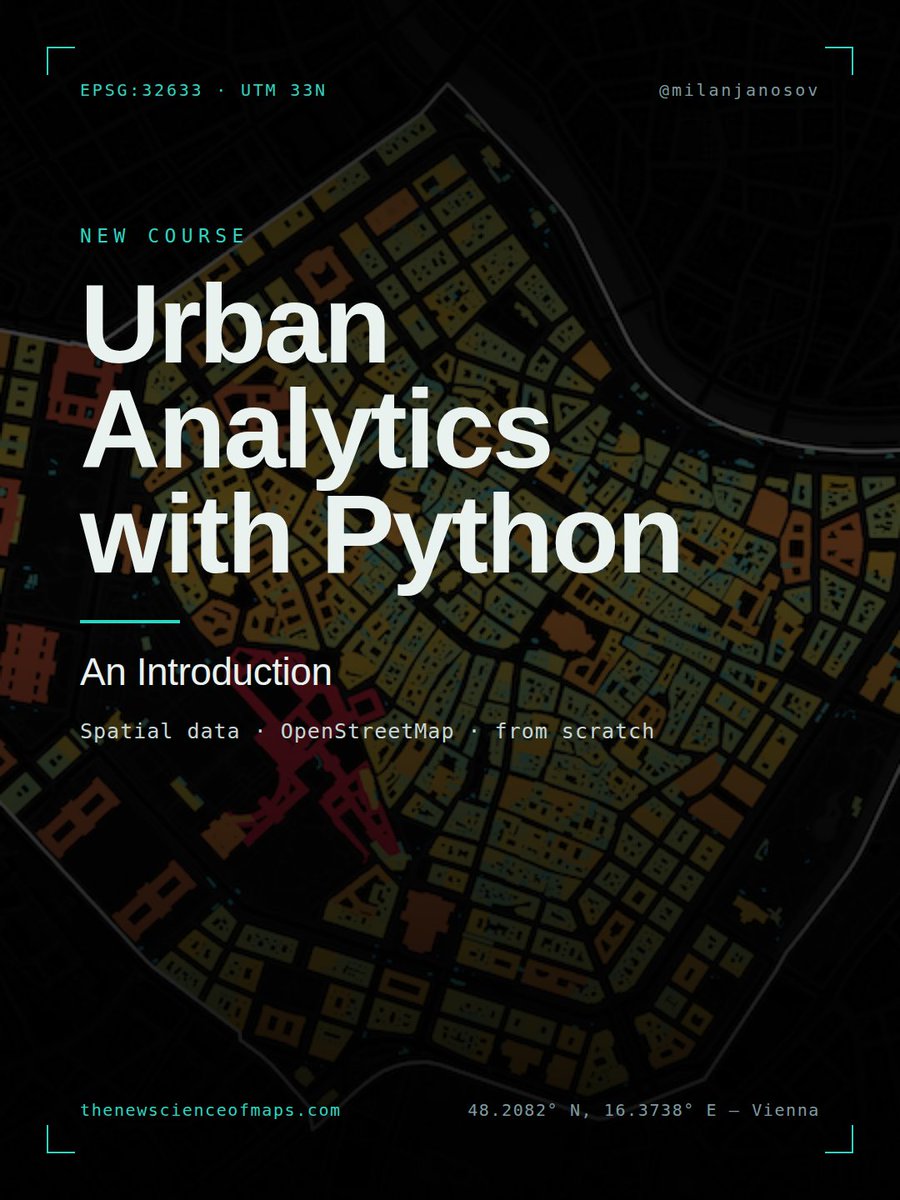
𝐔𝐫𝐛𝐚𝐧 𝐀𝐧𝐚𝐥𝐲𝐭𝐢𝐜𝐬 𝐰𝐢𝐭𝐡 𝐏𝐲𝐭𝐡𝐨𝐧 — 𝐒𝐩𝐚𝐭𝐢𝐚𝐥 𝐃𝐚𝐭𝐚, 𝐎𝐩𝐞𝐧𝐒𝐭𝐫𝐞𝐞𝐭𝐌𝐚𝐩, 𝐚𝐧𝐝 𝐭𝐡𝐞 𝐁𝐚𝐬𝐢𝐜𝐬 𝐨𝐟 𝐔𝐫𝐛𝐚𝐧 𝐀𝐧𝐚𝐥𝐲𝐭𝐢𝐜𝐬
Get started with urban analytics in Python following my new course:
1 · Setting Up — The study-area pattern the whole course runs on: one place name resolves to an administrative boundary, and everything clips to it. Change one string, and the analysis re-runs on a new city.
2 · Acquiring Urban Data from OSM — Boundaries, cafes, parks and footprints, pulled from OpenStreetMap by tag. Pull a generous bounding box, then crop it to the exact shape with a spatial join.
3 · Buildings — Every footprint via one query, the messy tag table screened down to what's actually populated, mapped by function, and measured in real square metres. (And why a footprint isn't floor space.)
4 · Road Networks — The city as a graph of intersections and segments. Drive vs. walk networks, structural hubs, segment-length texture, and road-class hierarchy.
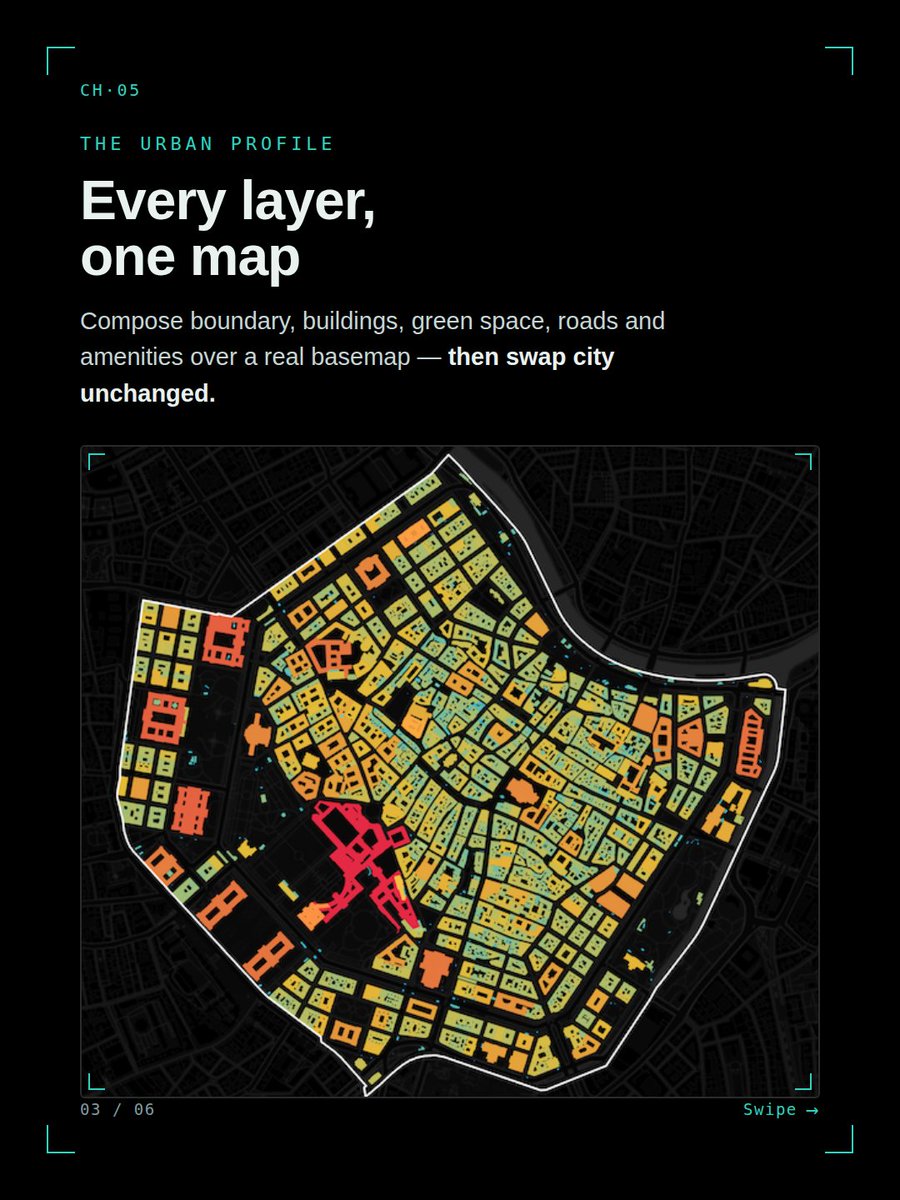
5 · Basemaps, Projections & the Urban Profile — Real basemaps, the declare-vs-reproject CRS distinction every measurement depends on, and every layer composed into one urban profile — then swapped Vienna → Budapest unchanged.
6 · The Livability Index — All 23 Vienna districts. Ten OSM KPIs across five dimensions, normalised and weighted into a single rankable, mappable score — with every assumption on the table.
𝐒𝐚𝐦𝐩𝐥𝐞 :https://t.co/YJmMH4uOBC
▶ 𝐄𝐧𝐫𝐨𝐥𝐥 𝐧𝐨𝐰 https://t.co/qKM1WD1fnm
🗺 𝐓𝐡𝐞 𝐍𝐞𝐰 𝐒𝐜𝐢𝐞𝐧𝐜𝐞 𝐨𝐟 𝐌𝐚𝐩𝐬: https://t.co/dhdrB98c5J
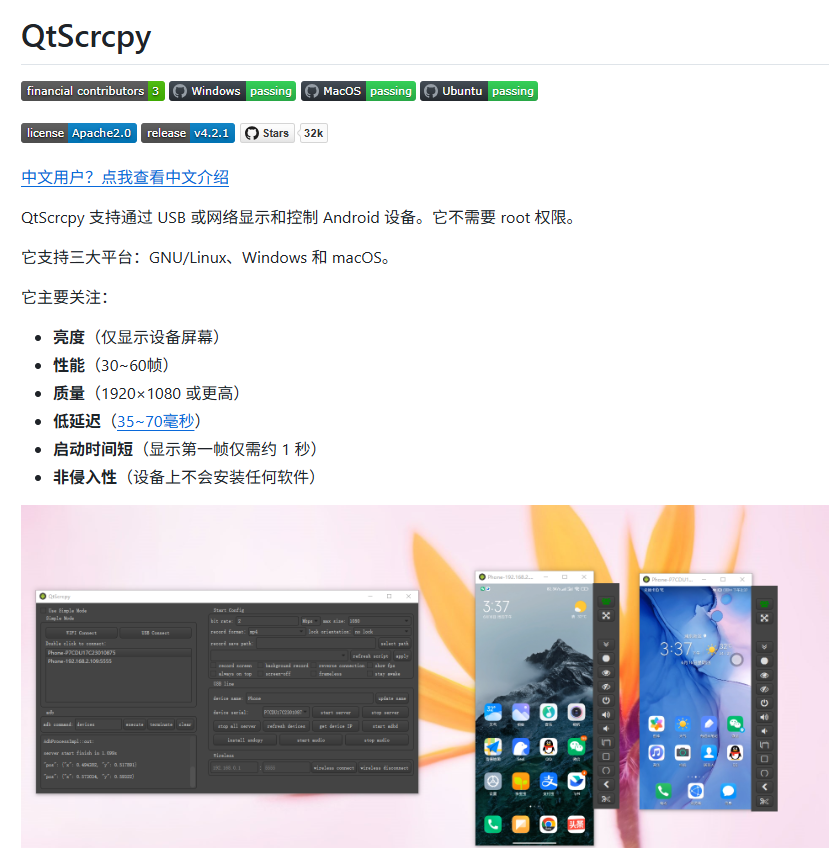
想在电脑上直接操作安卓手机?QtScrcpy 就挺方便。
它可以把手机画面实时投到电脑,再用鼠标键盘直接控制:
① USB 或 Wi-Fi 都能连接
② 支持录屏、文件传输、安装 APK
③ 延迟较低,日常操作比较流畅
④ 一台电脑还能同时连接多部手机
开源免费,Windows、macOS、Linux 都支持。
🔗 https://t.co/fv6n6Tnnlx