I look at hundreds of charts a day.
📈📊📉
After the bell, I curate the best ones and send them to investors.
Subscribe to be one of them 👇
https://t.co/n7eCrpXfel
"The S&P 500 has now spent 52 consecutive weeks with its 10-week moving average above its 40-week moving average ... Until that changes, the trend deserves the benefit of the doubt."
@granthawkridge
"May shattered previous activity records in cash equities ... From this peak, activity has accelerated further in June, with volumes this month tracking 9% above May's record"
-Citadel Rubner
A lot of people asking. Why the cycle is real? Because it is a self fulfilling prophecy when enough people are convinced. Market shrugged Strait of Hormuz, anticipated that Trump would not humiliate himself with recession til Democrats win presidency to blame for 2029 recession.
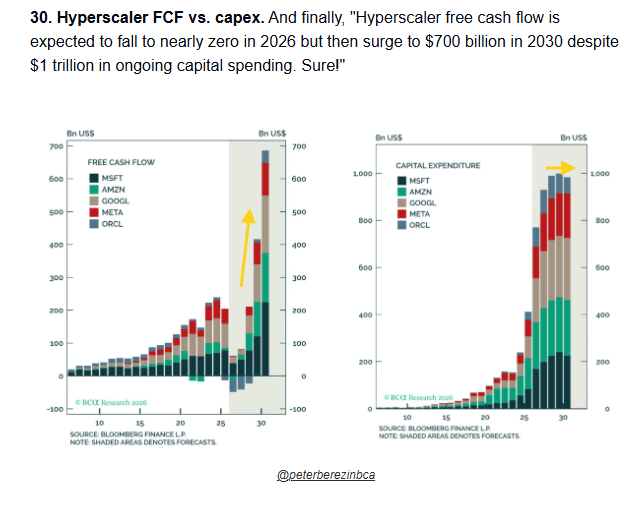
Interesting chart from @peterberezinbca featured in the @dailychartbook nightly email showing that expectations are for hyperscaler free cash flow to surge in coming years as cap ex flat lines while revenues continue to grow at their astounding rate (expected at 30%+ for 2026).
This is in line with Goldman's note earlier this week that it seems analysts are likely either overestimating revenue growth or underestimating the cap ex required.
🇺🇸 Valuations
Profitability gaps go a long way in explaining why equity indices trade at different valuations. Companies that generate higher returns on equity typically earn richer multiples
👉 https://t.co/blMxcoFA78
h/t @dailychartbook $spx #spx
Technology related companies now account for approximately 60% of total stock market capitalization, marking the highest level of sector concentration on record.
This unprecedented dominance highlights the increasing importance of digital infrastructure, artificial intelligence, and software driven business models in the modern economy, while also illustrating the growing concentration of equity market returns within a relatively small group of large cap firms.
Source: LSEG
🌱
The nightly email from @dailychartbook had their calculation of the $VXN Nasdaq-100 30-day implied volatility index vs the $VIX (SPX version) showing that also in what BofA would describe as "frothy" territory - the widest since July 2017.
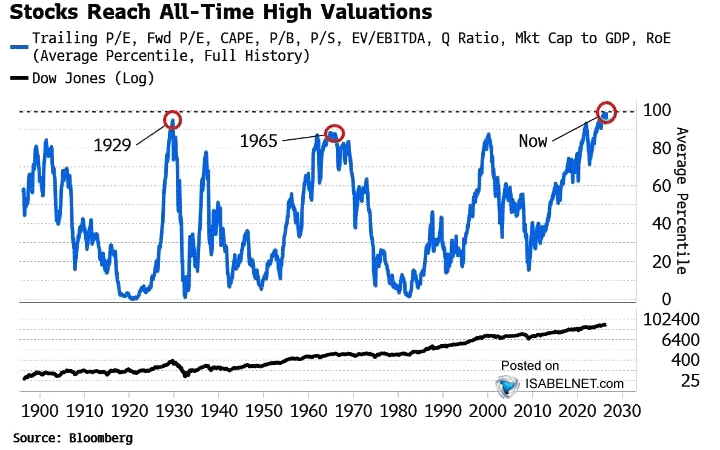
🇺🇸 Valuations
US stocks are priced for perfection, with valuations back in territory that has a habit of ending badly. Calling the turn is never easy, but when markets run this hot, even a modest slip in fundamentals can hit hard
👉 https://t.co/blMxcoFA78
h/t @dailychartbook
"The S&P 500 has now spent 52 consecutive weeks with its 10-week moving average above its 40-week moving average ... Until that changes, the trend deserves the benefit of the doubt."
@granthawkridge
"May shattered previous activity records in cash equities ... From this peak, activity has accelerated further in June, with volumes this month tracking 9% above May's record"
-Citadel Rubner