“What has worked in the past and will continue to work in the future.”
Markets change. Human behaviour doesn’t.
The best trading principles aren’t built around what’s trending today: they’re built around what has worked repeatedly over decades.
➜ Study what worked in the past.
➜ Master the principles.
➜ Adapt the execution.
Trading is my profession and my livelihood.
I support this movement because every retail trader deserves fair rules.
If you’re a trader, I request you to avoid taking even a single trade on 12th August 2026
Let’s stand together 💪
Pls Retweet For max Reach
Serious traders, this is a moment to stand together.
On 12th August 2026, don't place a single trade. Don't place a single order.
This isn't about missing one trading day. It's about sending a clear message that retail traders deserve fair rules, balanced regulations, and a market that supports participation—not discourages it.
Every trader who chooses to stay out of the market that day adds strength to the collective voice.
If we remain silent today, we shouldn't be surprised if future policies continue to ignore retail participants.
Whether you agree with every point or not, standing together peacefully is how meaningful conversations begin.
12th August 2026
No Trading. No Orders. Not Even One Trade.
Stand united. Make your voice heard.
Kar liya “Viksit Bharat” ka pehla stress test.
₹12,000 crore. 213 km. Inaugurated by PM Modi himself on 14th April with full pomp.
Not even 3 months in, and the “world-class” Delhi-Dehradun Expressway already has cracked slabs, leaking joints and potholes eating the road, even before monsoon peaked.
This isn’t bad luck. This is what happens when contracts get cleared faster than quality checks.
Where’s NHAI’s defect liability clause? Who signed the completion certificate? And who’s paying to fix a road that just opened?
12,000 crore roads shouldn’t need repairs in 90 days. Ask your MP why this one does.
🚩 Trading Flags 101: The Secret Behind 20–40% Breakouts
Here’s the core idea 👇
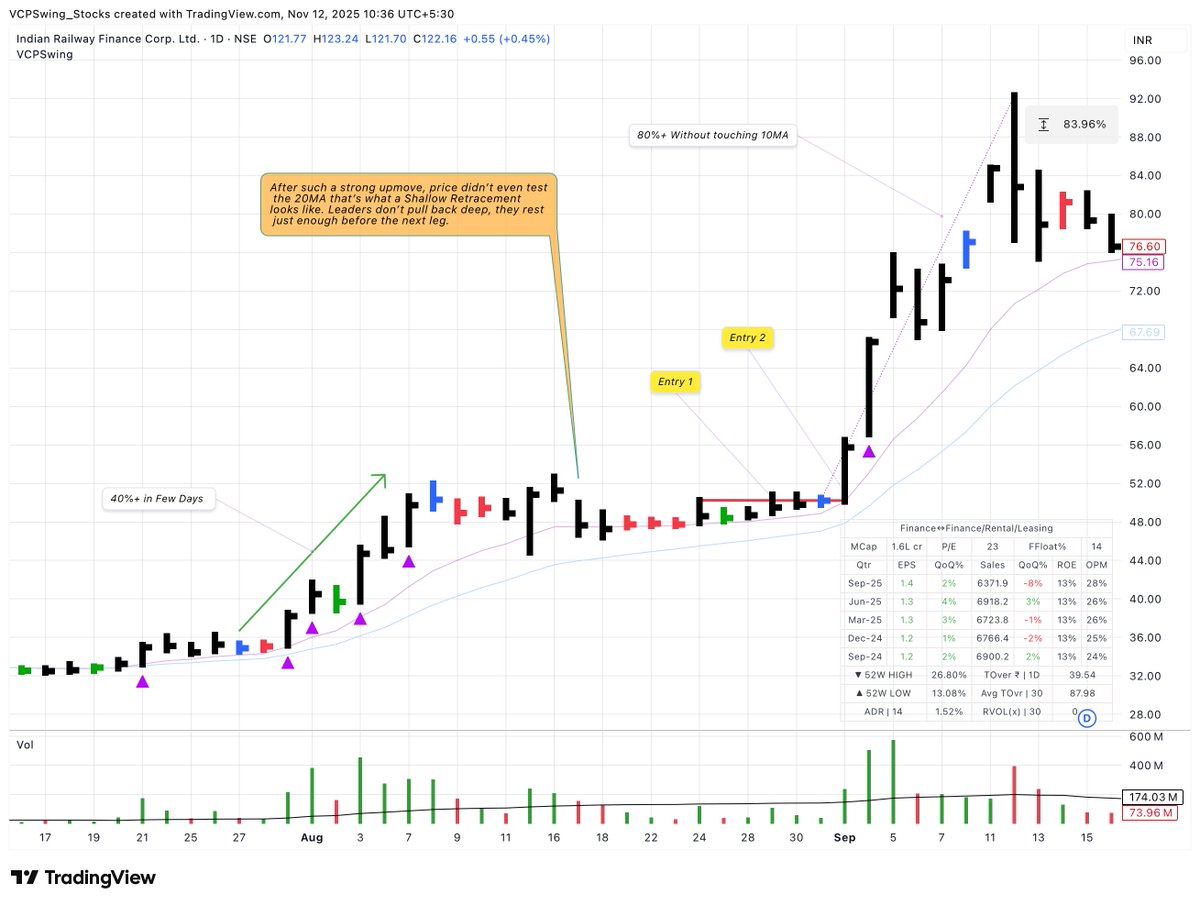
‣ Look for High Demand Stocks: 20–40% moves in just a few days.
‣ After a Big Push, the Shallow Retracement is the key signal : leaders don’t correct deep.
‣ On the Daily Timeframe, the stock should surf along the 10/20 EMA like a wave
‣ The best setups happen when you see Expansion after Contraction right near those MAs ,that’s where momentum re-ignites.
🔍 How to Scan:
1-Month Performance > 10%
Basic Liquidity Filter (no illiquid junk)
These are the stocks forming bullish flags or mini bases that can lead to the next explosive leg.
If this gets good traction (likes, retweets, shares). I’ll drop my Modelbook of real examples exhibiting these characters
Let’s see who wants it 👇
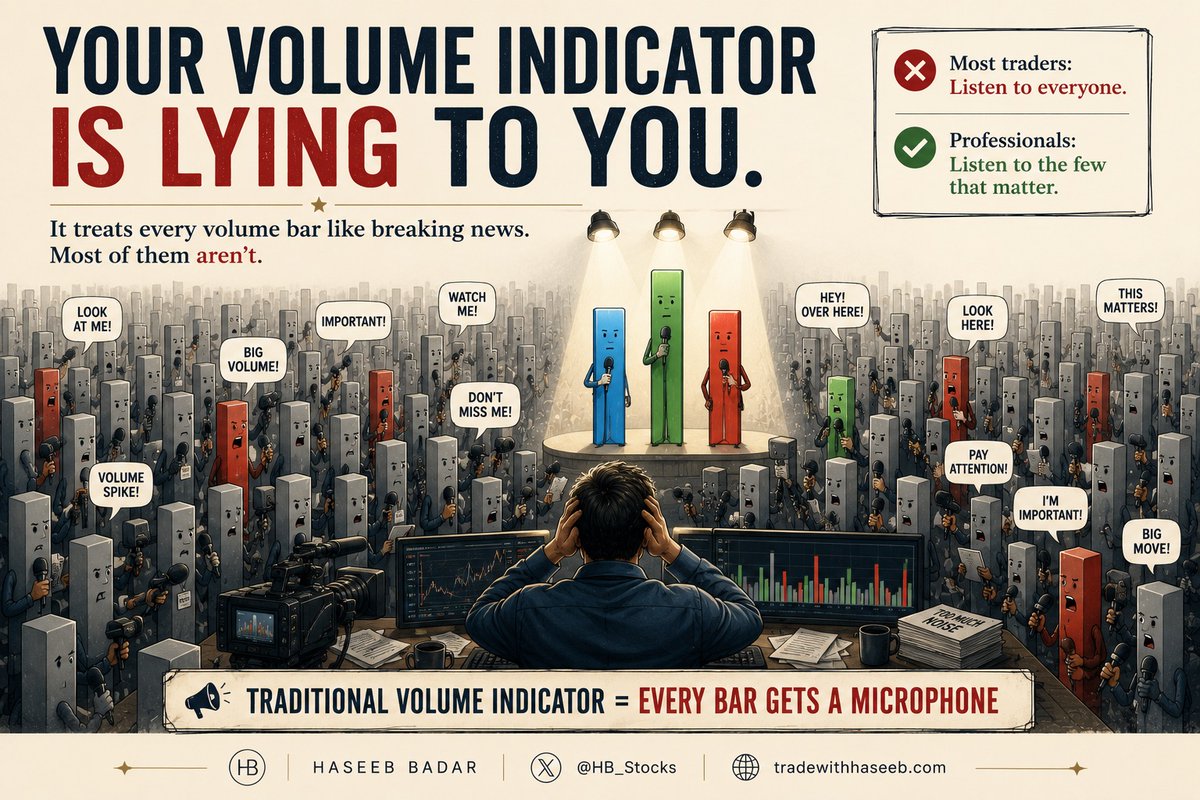
Your volume indicator is lying to you.
Not on purpose. It just treats every single bar as equally important — when 90% of them mean nothing.
A trader named Nitin (@finallynitin) fixed this. He built a volume indicator that hides the noise and shows you only what institutions are actually doing.
Once you see a chart through it, you can't go back ↓
🚨Presenting the "Persistency with moving averages" indicator for TradingView
I've been using this indicator since 2024. Decided to make it free for everyone!
Purpose: Stock selection
(by acting as a proxy for the nature/character of the stock)
Level: Intermediate
(beginner traders can skip this indicator)
Basic concepts
This indicator is inspired by the concept of Persistency introduced by @PradeepBonde. Bonde emphasizes that it's not just about knowing a trend's direction, but also about understanding how resilient that trend is over time. Stocks that consistently move in the direction of the trend have better odds of continuing that trend. By identifying such stocks, traders can improve their chances of catching both more and bigger winners.
Watch Stockbee's video for the original concept:
https://t.co/bbltOdIHWF
Bonde's original concept can be refined further by tracking how long a price has stayed in a certain trend direction relative to a key moving average. Instead of solely counting the instances where the close is higher than the previous close, this script tracks how many bars (periods) the price has stayed above or below certain moving averages. Moving averages act as dynamic support and resistance levels, providing a more nuanced view of price behavior.
Key Features
⦿ The heart of the indicator is the persistency count, which tracks for how many consecutive candles the price has stayed above or below a moving average. By using the counts to find stocks that have consistently moved in one direction, we can use this indicator for identifying Persistent trends.
⦿ Max Persistency is the historical metric that records the longest consecutive streak the price has spent on one side of an MA within a specific lookback period. This tells us the past nature/character of the stock i.e. whether the stock has respected a particular moving average in the past or not.
⦿ Decisive Exit: When enabled, the indicator starts a pending exit if the price closes below a moving average. A decisive exit occurs if the price breaches the low of the pending exit day.
Use Cases
⦿ Identifying stocks in persistent trends
⦿ Timing entries/exits via price/MA crossovers
⦿ Assessing momentum across multiple timeframes using MAs of different lengths