@currankelleher@saurabhp75@Datawrapper There's a million services that do the basics here (like https://t.co/RTWThXPDiO, ScreenshotCloud, https://t.co/8n6kwLWvHZ), but in the end requirements tend to vary so people build their own solutions. Cloudflare supports 'Browser Rendering' for their Worker runtime as well.
@SpecialElex@Datawrapper Sorry about that! Would you mind sharing the specific chart in question to [email protected]? Then we can investigate what went wrong here 🙏
@KMSilverTweets @tasneemraja@Datawrapper@Oaklandside You can use Datawrapper fully for free, and use all the features Oaklandside used: https://t.co/mHyFIgwCNl
@Jason Half is the tool, the more important half is knowing the best practices.
#1 we can provide for you: https://t.co/ao5T3tgK6l
Turns out #2 as well: https://t.co/5x8XIzhsKq
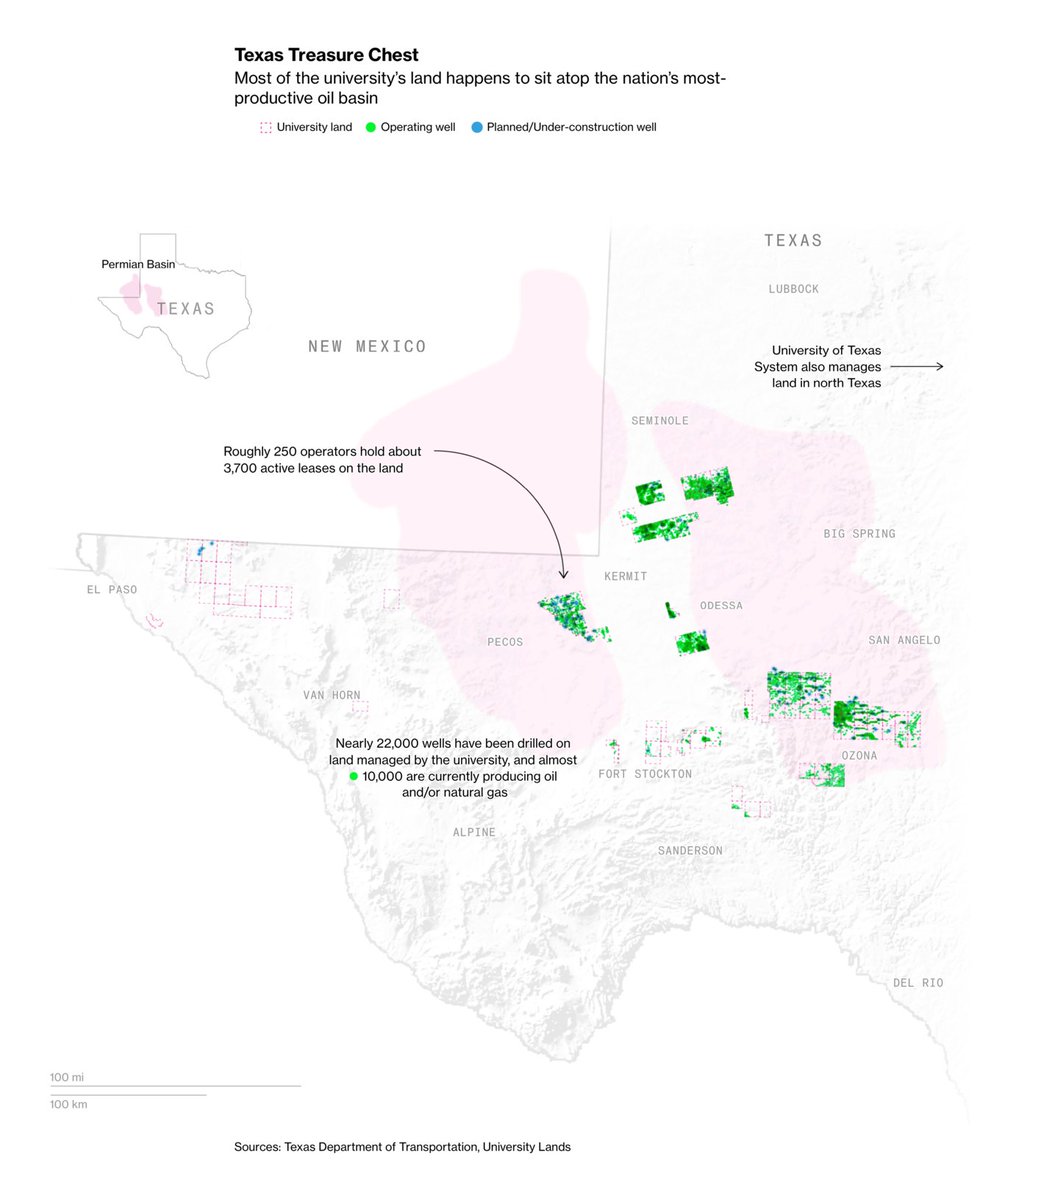
New Data Vis Dispatch! And it's full of beautiful maps 🗺️
After today, we'll be taking a little late-summer break and publishing the Dispatch only every other Tuesday until the end of September 🏖️
See more of this week's best on our blog:
https://t.co/Cuzeb1R4t8
@baekdal@luckyisgood Most features other charting tools like to charge you $49 a month for (using all viz types, unlimited charts, non-public charts, embedding on the web, exporting as image), we offer for free instead. So in practice, it's more a matter of "more free features" than "higher price"