The path to launch is filled with obstacles and success is only possible through the tireless efforts of many working together towards a common goal. “Critical Path” continues the ongoing Starship series, following SpaceX engineers through the final days before launch of the first Starship V3 and the challenges that come with development of the world’s most powerful and fully reusable rocket.
This will make you millions in the stock market. Save this so you ALWAYS know what will happen.
One of my secrets is always monitoring HEAVY truck sales.
When the economy turns weak, companies are the first to react by lowering spending and procurement, causing heavy logistics to decrease. Conversely, when economic conditions improves, the purchase of trucks would rebound. It's that simple.
When truck sales are above 0.47M (top quartile):
1. economy is running hot
2. start playing a bit more defensive
3. raise quality in your portfolio
When truck sales are between 0.25M and 0.47M:
1. normal range
2. stay the course
3. hold your winners
When truck sales crash below 0.25M:
1. the economy is bottoming
2. get aggressive
3. this is where generational wealth is built
Right now?
Truck sales are at 0.43M. 73rd percentile. Not in the danger zone yet.
I'm issuing my first ever *SWAMP ASS WARNING* for the entire state of Florida the next 3 days thanks to extra heat and humidity. It'll feel like 105 - 114°. Stay cool y'all! 🤣🥵
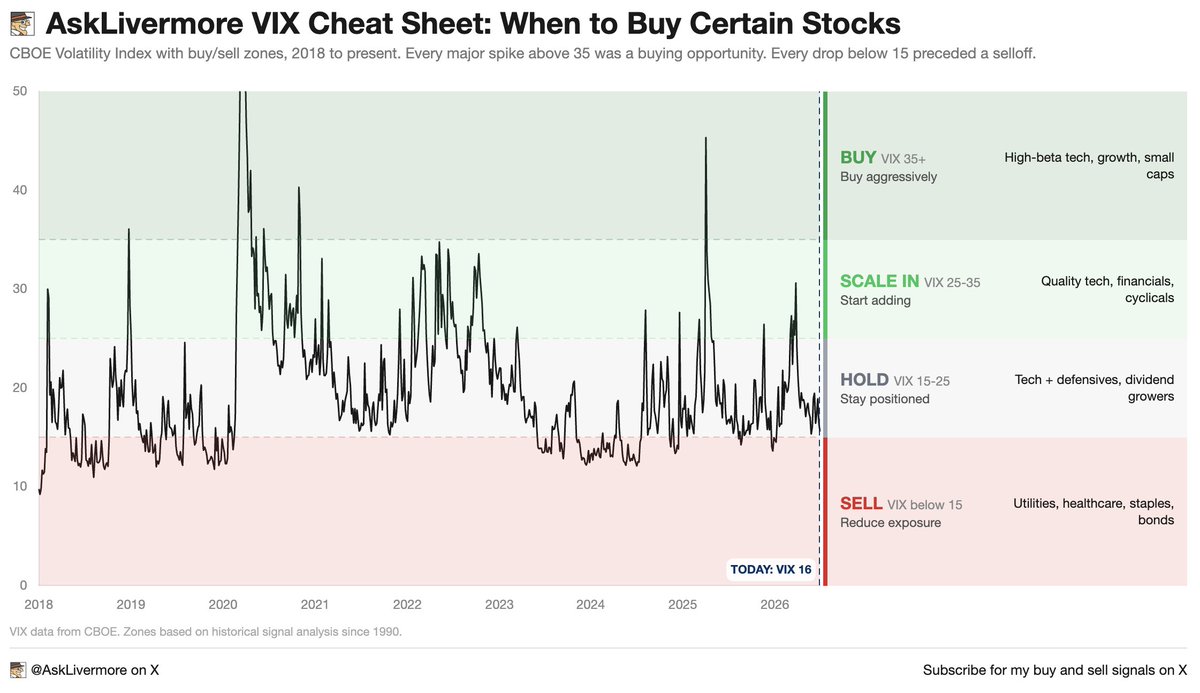
This is all you need to do to make millions in the stock market. Save this. Screenshot it. You will need it.
1. VIX above 35: buy aggressively
- High-beta tech, growth, small caps
- Every single time the VIX spiked above 35 since 2018 was a generational buying opportunity. COVID bottom. Oct 2022 bottom. Tariff crash. If you bought when everyone else was panicking, you made a fortune.
2. VIX 25 to 35: start scaling in
- Quality tech, financials, industrials, cyclicals
- This is where smart money starts building positions. Not all at once. Gradually. The fear is real but the opportunity is bigger.
3. VIX 15 to 25: hold
- Balanced: tech + defensives, dividend growers
- This is normal. Stay positioned. Don't chase, don't panic. Let your winners run.
4. VIX below 15: reduce exposure
- Rotate to: utilities, healthcare, staples, bonds
- This is when everyone is comfortable. Nobody is hedging. Nobody is worried. That's exactly when you should be.
- Every major crash in market history was preceded by the VIX sitting below 15 for weeks.
Right now the VIX is at 16. We're in the hold zone. Stay positioned but stay alert.
Bookmark this. The next time the VIX spikes above 35, don't freeze. Buy.
$CRWV finally getting some love it deserves.
BoA, Wells Fargo, BNP Paribas all reiterated Overweight with $150 targets after flagging a big Q2 backlog beat and ~90% of the 2027 $30B ARR target already secured.
Wall Street’s largely on board with the AI infra story.
From a technical setup, $CRWV just needs to break above the pivot high and it's off to the races.
Is $AMZN primed for big gains?
The Chart Master @CarterBWorth sees a breakout ahead in the charts. @GuyAdami, @karenfinerman and Julie Biel debate the fundamentals.
https://t.co/oS8MJkkkt6
This is literally the most extreme momentum event in 40 years of recorded data. The Nasdaq 100's RSI went from 28 (oversold) on March 30 to 70.5 (overbought) by April 15 — in just 11 sessions. That is the fastest oversold-to-overbought transition in the Nasdaq 100's 40-year recorded history. The previous fastest was 25 sessions after Liberation Day last year. The historical average is 60+ sessions. Benzinga
According to Bespoke Investment Group, this also marks the fastest move from a correction of this size to a new record high since 1928. Yahoo Finance
The forward return data is actually quite bullish long-term. Across all 44 historical episodes where the Nasdaq gained 11% or more in 10 sessions, the 12-month forward return averaged +24%, with a median of +30%, and a win rate of 80%. At 6 months, the win rate is 74%. Benzinga
But the near-term pullback is almost guaranteed. The average maximum drawdown following these signals was −18.39% — meaning while the 12-month destination is historically higher, the journey involves deep, punishing pullbacks that can severely impact over-leveraged portfolios. Ainvest
The key number to watch: Based on the 6 most comparable historical analogues — COVID recovery (−8%), Liberation Day 2025 (−4%), Fed pivot 2018 (−6%), Asian crisis 1997 (−7%) — the most probable near-term pullback is 3-8% within the next 2-4 weeks. The April 22 ceasefire expiry is the most likely trigger. After that consolidation, the historical data overwhelmingly favors a resumption of the bull trend.
The S&P 500 has experienced average intra-year declines of roughly 14% since 1990, even in years that finish strongly positive — and the average correction (10-20% decline) lasts just 17 days. U.S. Bank
A pullback here isn't a disaster; it's the historical norm and historically the best re-entry point.
Wes and I are extremely well positioned in the leaders.
The Chartmaster @carterbworth says it's time to play software for a mean reversion as the $IGV slid lower for a seventh day in a row.
He lays out the techinicals at the telestrator!
@guyadami@timseymour react.
https://t.co/vLiAkRfI5B
The next three years could be Reaganomics on steroids, another golden age for the US equity market. Back then, early in my career, I remember how deregulation, tax cuts, sound monetary policy, and peace through strength sent the dollar soaring, which put a lid on the gold price!