Most people quit charts because they look random.
Elliott Wave taught me they're not.
I'm still learning — so I'm sharing every count, setup & mistake here, daily.
From beginner to consistent, in public.
Follow the journey 📈
@TheMarketTell If $499 marked the Wave 5 top, then a bounce into $400-$415 fits well as a B-wave before the final C leg down toward your 310-325 zone. The main risk to the count would be a strong reclaim of $415 on volume — until then the corrective structure looks intact.
@AsafNaamani Trading above $191.46 without a convincing close is exactly the kind of breakout worth letting confirm — a weak candle above resistance often retests before the real move. Waiting for follow-through rather than chasing the first push looks like the disciplined read here.
@EchoAnalysis Holding the count into earnings takes conviction — the 0.786 retracement at $53 lining up with your heavy-buy zone is a clean level to lean on if tonight brings a flush. Curious whether a gap below $53 would still fit the wave structure or force a re-count.
@ElliottForecast The 67.05 invalidation makes sense as the pivot for this corrective sequence — as long as it holds, the setup for another leg higher stays intact. Do you have a preferred support zone where you'd expect the corrective wave to complete before that advance?
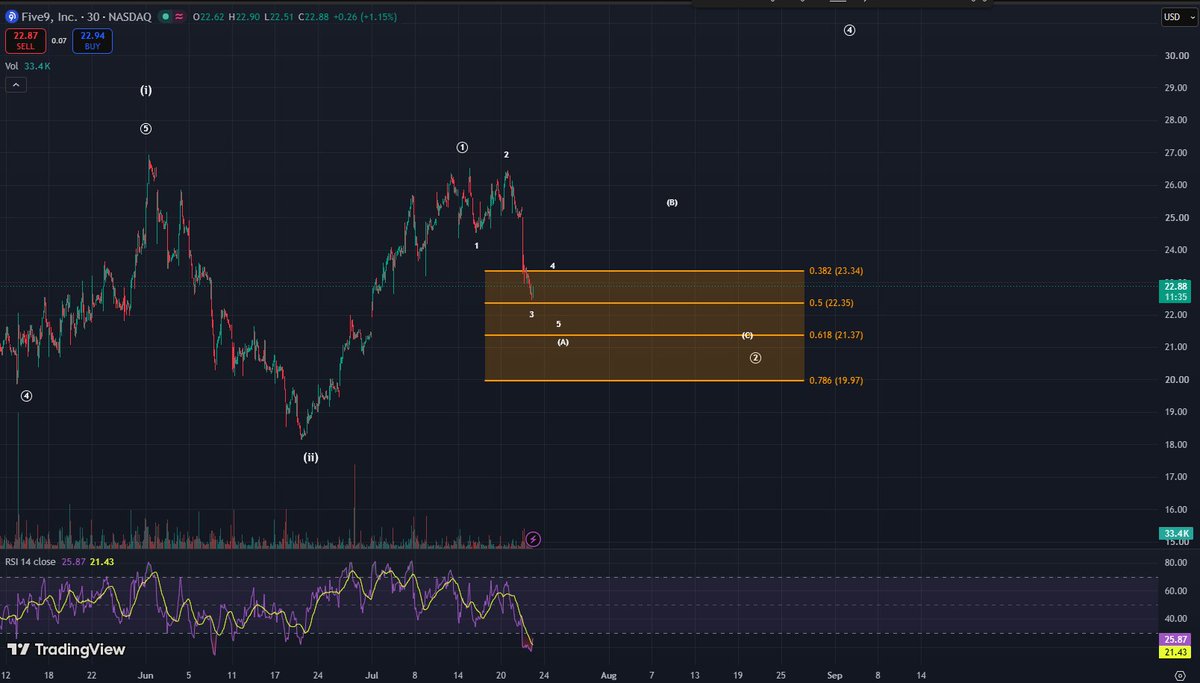
$FIVN
Wave 1 could have topped, so we could be in a wave 2 pullback now, but there's still a chance wave 1 extends a bit more to the upside.
NFA · DYOR
@psychestan The wave-3 extension into the 1.272 at 4,101.31 looks clean on the 5m. Expecting price to stretch toward the 1.618 before a wave-4 pullback, or trimming into the 1.272 first?
$RACE
We could be in the C wave of wave 2. I think it's likely that the C wave will bottom in the 0.618–0.786 retracement area.
What do u think?
NFA - DYOR
@TheLongInvest The harder part of this is usually structural: if price is in a third wave the "fair price" pullback never really comes, whereas a wave 4 gives you the retrace but tests conviction hardest. Do you have a level where you'd stop waiting for the add and just size in?
@rotationalinv Clean setup ,the wave 2 trendline plus RSI divergence at the wave 5 low is the classic combination for a completed C or 5. Worth noting the count only stays valid while that wave 5 low holds, so the stop placement is doing real structural work here, not just risk management.
@The_GreenSeeker The B-wave description is the one most people underestimate, it routinely retraces 61.8-78.6% and gets relabelled as a new impulse in real time. Worth adding that a truncated C is the exception that catches people leaning the wrong way at the end.
@AviHarkishun If wave A is complete here, the B-wave retrace is the part that usually traps people , it can reclaim a lot of the drop without invalidating anything. Are you treating the bounce as tradeable, or waiting for the C leg to confirm the larger correction?
@TheLongInvest The 0.618 is where most wave 2 pullbacks find their footing, so adding there is consistent rather than contrarian. The real tell will be whether the bounce comes with impulsive structure or another overlapping leg.
@slp_charts Adobe has been grinding down since the $560 area, so the question is whether this is a terminal wave 5 or still a wave 4 consolidation. What's your invalidation level on the bottom thesis, the December low, or something tighter?
Everything in Elliott Wave is a guideline except three things.
1. Wave 2 never retraces 100% of wave 1
2. Wave 3 is never the shortest of 1, 3, 5
3. Wave 4 never enters wave 1's territory
Break one and the count isn't weak. It's invalid.
Which do you see broken most?