@AlanVRK@Frencheconomics Three thoughts:
1) UK's growth rate is better than we thought (good news), but levels vs our peers matters too
2) I use current PPPs to compare levels
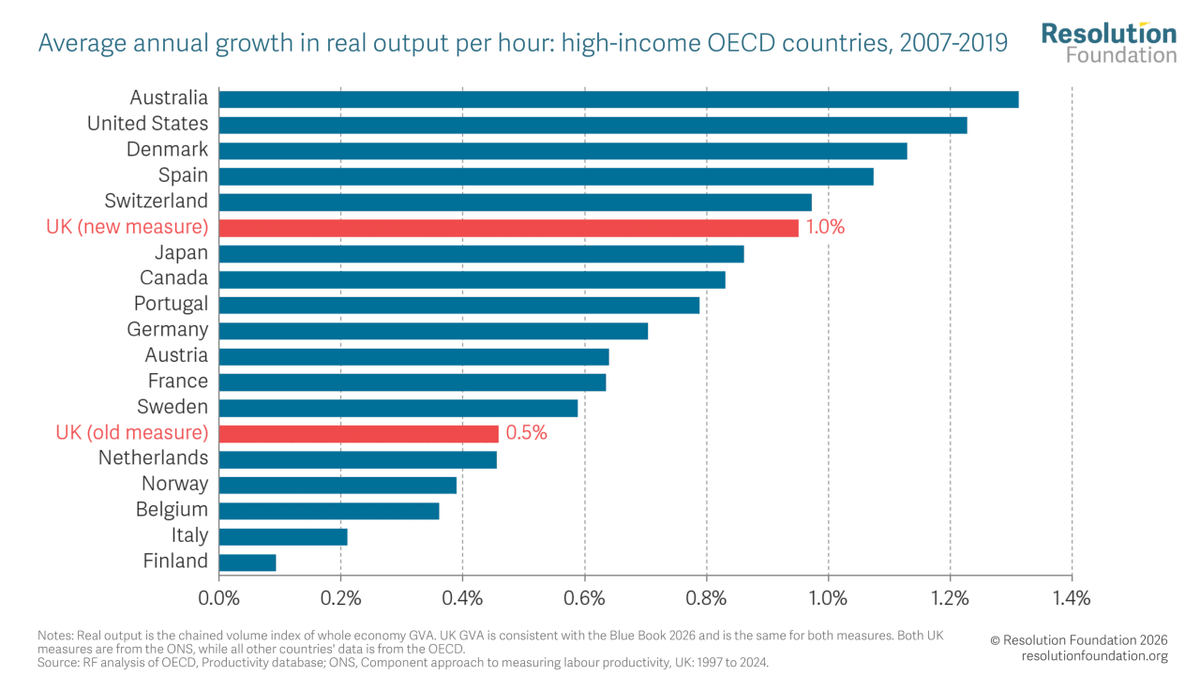
3) Italy, Germany & France had very different decades (see this @resfoundation chart)
@John_Stepek It suggests our weak productivity pre-dates the GFC. My hypothesis is weak investment (public & private) which has left us with less capital per worker than Europe.
And then we still have a post-GFC prod growth slowdown - where we now look a little better than Germany etc...
I keep seeing these takes today - that the ONS's data update wipes away the UK's weak post GFC productivity record.
But that isn't quite right.
The new hours measure improves the UK productivity growth story, but the UK's productivity level was still weak.
A🧵
The other interesting thing about the revised productivity data is that it turns out all those acres and years of columns agonising about Britain's uniquely awful productivity were presumably just wrong.
@John_Stepek I agree that it looks like the Uk slightly outperformed Germany on real prod growth in the 2010s, which narrows the gap a bit. But it doesn’t change big picture - at current PPPs UK productivity was still ~80% of Germanys in 2019
The genuine good news is that Britain's productivity does seem to be picking up. Output per hour has grown 2% a year over the last two years, about double the 2010s.
And the UK is starting to narrow its productivity gap with Germany and France.
https://t.co/UZ7dZNKKV4
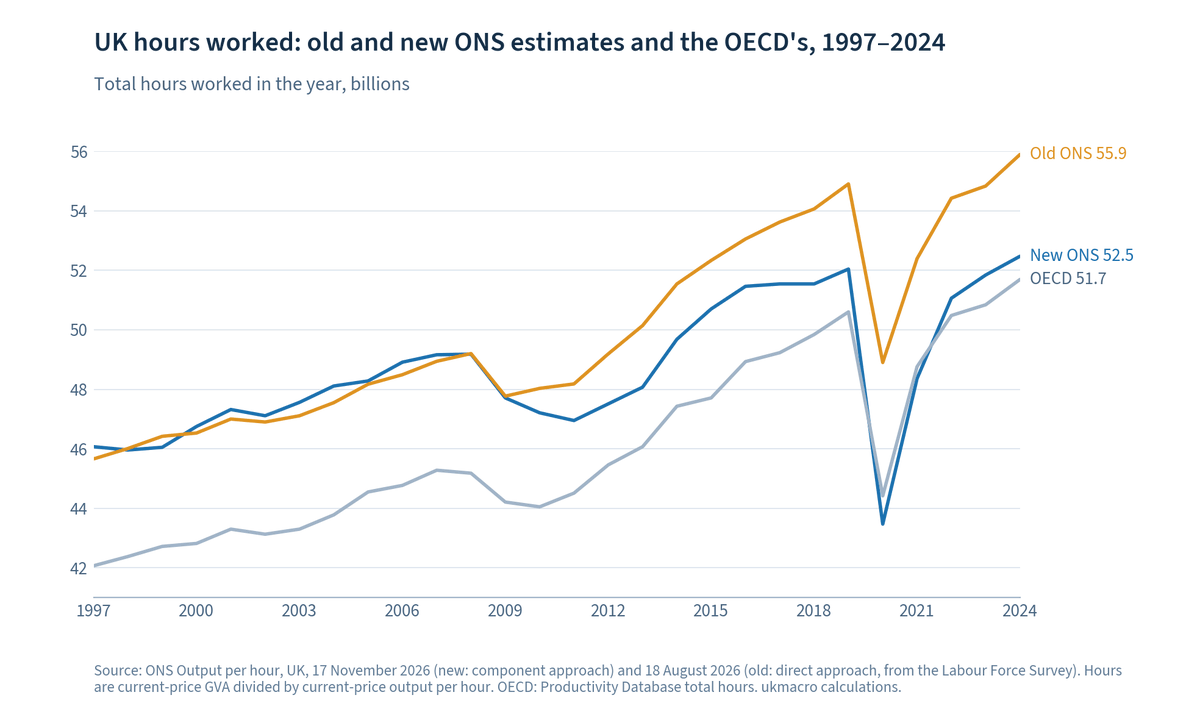
The key change is hours worked moving to the more accurate component approach since 1997. I've backed out total hours from the ONS productivity series - and the split happens post 2009.
Worth noting the OECD was already doing it's own (more blunt) adjustment for comparisons.
Truck crashes result in 160,000 nonfatal injuries and 6,000 fatalities every year in the US.
Hour tracking devices - ELDs - were mandated in 2012, aiming to make trucking safer by stopping truckers driving long hours (by stopping falsification of paper records). Did they?
As Helen says, policy can get more generous sensibly - the min wage took a steady path to reach its target of 2/3 median earnings.
The triple lock's annual ratchet wasn't that.
The PM's adj triple lock –rising by prices or 2.5%, & keeping the earnings link – is good policy.
I'm getting grumpy at claims that the old triple lock is a good way to increase the generosity of pensions relative to earnings
If a higher pension is desired -> just state the level &when you want to reach it; don't just hope that at some unknowable future date it happens
Personal update: I'm joining the Bank of England for six months - stepping away from my Resolution Foundation desk. I will be tweeting a bit less while I’m heads-down on policy work, but will see you on the other side!
What is driving Britain’s place-based wage divides?
While regional pay inequality is widely discussed, what drives these divides is less well understood.
Join us on Monday to discuss with @xiaoweixu_@henrimurison Rachel Taylor, @GregoryThwaites & Ruth Curtice 👇
https://t.co/LrCTDyH2pk
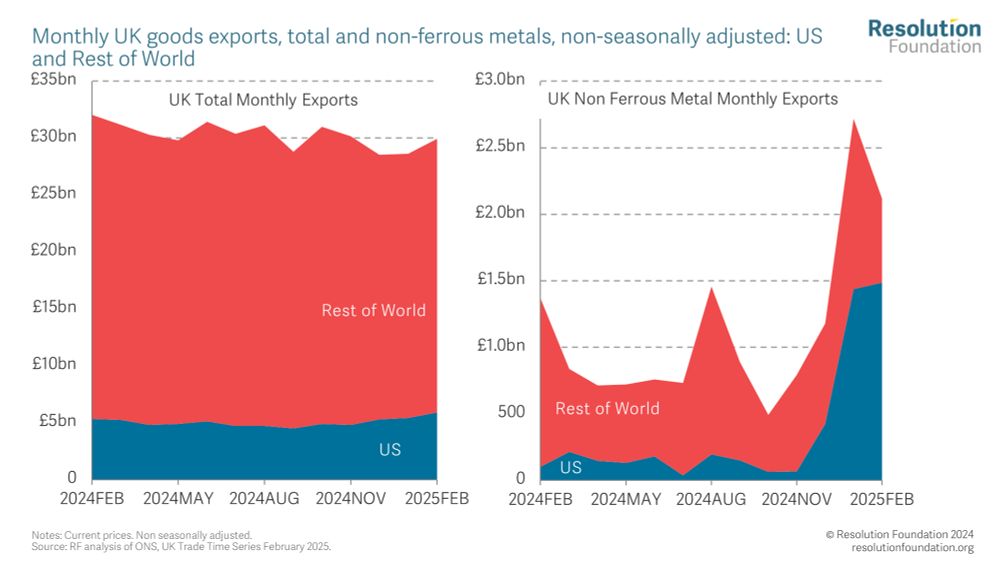
This is based on the latest UK data (February 2025).
But with tariffs ramping up from March and trade flows shifting, one thing’s certain: there’s more volatility ahead.
As of February, the biggest contributor to that surge is... non-ferrous metals.
Exports of non-ferrous metals to the US (aluminium, copper, and *precious metals*) are up 1,358% since Feb 2024.
This isn't a global trend: exports to the RoW fell 50% since Feb 2024.
Non-seasonally adjusted UK goods exports to the US have jumped 31% since September 2024 (vs -1% to RoW), and are up 11% since February 2024 (vs -10% to the RoW).
What are we sending? More cars? More pharma?
Not quite.
Yesterday’s US GDP release showed how businesses can quickly respond to tariff threats.
Real US GDP fell 0.3% in Q1 2025 vs Q1 2024, dragged down by a surge in imports and inventories.
The headline number is tricky to interpret, but is the UK part of this surge?