🙌 Our last manuscript is out.
👉“Safety of Very Low LDL-Cholesterol:
Ten Common Concerns, Misconceptions, and Evidence-Based Clarifications”
📍Very low LDL-C levels continue to generate debate, fear, and misinformation in clinical practice.
📍In this review, we critically examined 10 of the most frequent concerns related to intensive LDL-C lowering:
— Cognitive decline
— Hemorrhagic stroke
— Cancer
— Cataracts
— Hormonal dysfunction
— Diabetes risk
— Muscle symptoms
— Older adults
— Sex differences
— Overall cardiovascular benefit
📍The key message is clear:
RCTs, meta-analyses, and genetic evidence consistently support the safety profile of very low achieved LDL-C levels in appropriately selected high-risk patients.
📍Some adverse effects are real — particularly statin-associated dysglycemia and muscle symptoms — but their absolute risk is generally modest compared with the magnitude of ASCVD risk reduction.
📍Therapeutic inertia and misinformation remain major barriers in preventive cardiology. Evidence-based communication matters.
📍Lower LDL-C. Earlier. Longer. Safer than many still believe.
☝️Proud to collaborate with outstanding colleagues from Latin America, Europe, and beyond in this international effort.
🔗 https://t.co/zEMcECn9El
@society_eas@ATHjournal
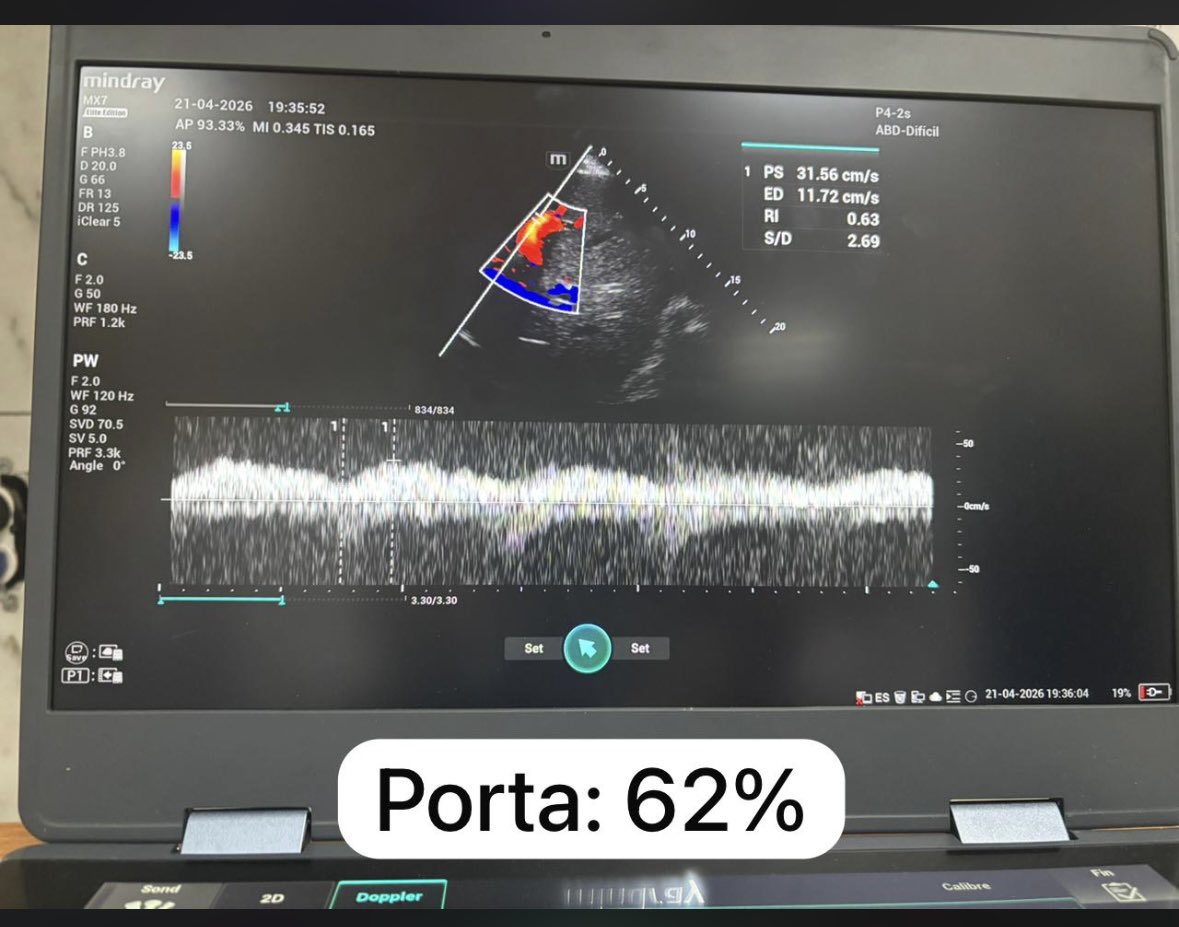
Guiando TRRC en descongestión por Ecocardiografia de Cuidados Críticos
Relación E/A: 2.5
Relación E/é: 32.6
Presión capilar pulmonar estimada por Nagueh: 32 mmHg
Porta: 62%
LUS score : 25
#UTIC#TRRC#ECOCRITICO
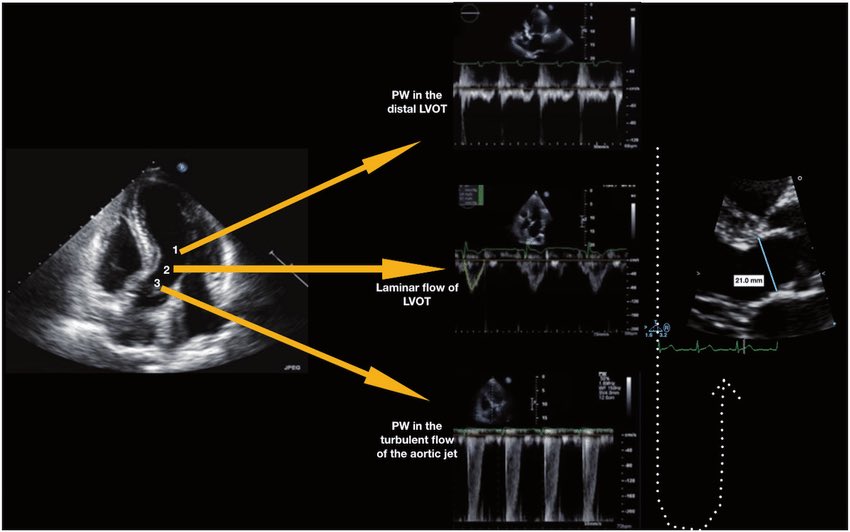
🫀 Did you know where the recommendation to place the pulsed wave Doppler sample volume 0.5–1 cm from the aortic valve to measure LVOT VTI comes from?
The answer is more interesting than it seems. It doesn’t come from a single study or an experiment designed for that purpose. It comes from a historical chain spanning nearly 40 years:
🔬 1982–1984 — The physical foundation
Pasipoularides and Murgo demonstrated using invasive catheters and mathematical models that in aortic stenosis there is a real zone of flow acceleration in the LVOT, just proximal to the valve, without any second anatomic obstruction. Pure hemodynamics — no Doppler yet.
👉 Bird et al. Circulation 1982 → https://t.co/oCXGNgWsPF
👉 Pasipoularides et al. Am J Physiol 1984 → https://t.co/cfvNMpEgzG
📐 1984 — The apical 5-chamber view
Lewis, Kuo and Quinones were the first to validate cardiac output measurement using pulsed wave Doppler from the cardiac apex. They described placing the sample volume “immediately proximal to the aortic valve leaflets” — but without specifying any distance in centimeters.
👉 Lewis et al. Circulation 1984 → https://t.co/lRVjLuYMEs
📏 1985 — The first numerical distance
Skjaerpe, Hegrenaes and Hatle (the Norwegian group) were the first to quantify this in Doppler: they empirically observed that flow acceleration began 0.5 to 1.5 cm proximal to the valve, and placed the sample volume just proximal to that zone. They directly cited Pasipoularides as supporting evidence. This was the first time a numerical distance appeared in the technique.
👉 Skjaerpe et al. Circulation 1985 → https://t.co/rf7l2FQUs4
📊 1986–1988 — Practical consolidation
Otto et al. used ~1.0 cm. Oh, Tajik and the Mayo Clinic group explicitly established the range of 0.5 to 1.0 cm in 100 patients, justifying it as necessary to avoid the subvalvular acceleration zone. This is the figure we all recognize today.
👉 Otto et al. JACC 1986 → https://t.co/avke1qOy4x
👉 Zoghbi et al. Circulation 1986 → https://t.co/KFiChfBNuc
👉 Oh et al. JACC 1988 → https://t.co/1C8sHRSMPq
📋 2002 — It becomes “official”
Quinones, Otto, Zoghbi and colleagues codified it in the ASE guidelines as “~5 mm proximal to the aortic valve”… but without citing any specific study to support it. It had already become expert consensus.
👉 Quiñones et al. JASE 2002 → https://t.co/U3hXFns4jx
⚔️ 2017 — The debate reopens
Baumgartner et al. (EACVI/ASE) maintained the 0.5–1 cm recommendation. However, Hahn and Pibarot responded with a critical letter pointing out that the original articles from the 1980s measured at the aortic annulus, not 0.5–1 cm below it, and that moving away from the annulus introduces errors due to the elliptical and irregular shape of the subannular LVOT.
👉 Baumgartner et al. Eur Heart J Cardiovasc Imaging 2017 → https://t.co/iu07xBTwQS
👉 Hahn & Pibarot. JASE 2017 → https://t.co/uqgcv8kzO7
💡 Bottom line:
The 0.5–1 cm figure was never experimentally validated as the optimal distance. It emerged from empirical observations in the 1980s aimed at avoiding a flow acceleration zone that had been demonstrated with invasive catheters. It was adopted through accumulated clinical practice and later elevated to a formal recommendation by consensus. The debate over whether to measure at the annulus or 0.5–1 cm below it remains open to this day.
One of those recommendations we all follow but few know where it actually came from 🙂
Dr Benigno Valderrábano Salas
@MDBeni@JaeKOh2@ottoecho@WilliamZoghbi@ASE360@EACVIPresident@NephroP@iamritu@PPibarot@hahn_rt@MAecocardio@SISIACOficial@SONECOM_AC@VazyurVasquez@Cardiotweets83@HEARTof_echo@echobasics
New ACC/AHA Lipid Guidelines 2026 — Practice-Changing Insights:At a glance..
📌 Core Philosophy
“Lower LDL-C, earlier and for longer → better lifetime ASCVD reduction.”
🔬 1. Start Early – Think Lifetime Risk
Lipid screening should begin at ≥19 years, with repeat every 5 years or earlier in high-risk individuals.
Statin therapy can be initiated as early as 30 years if LDL-C ≥160 mg/dL, strong family history, or high 30-year risk—even if 10-year risk is low.
🎙️Key shift: Move from “10-year risk” to lifetime cumulative exposure model
🧮 2. PREVENT Risk Calculator Replaces PCE
New AHA PREVENT tool improves ASCVD risk prediction and starts risk estimation from age 30.
Includes 30-year risk estimation, crucial for younger patients.
📊 3. Recalibrated Risk Categories
Low: <3%
Borderline: 3–5%
Intermediate: 5–10%
High: ≥10%
👉 Clinical implication: Statins now justified at lower thresholds (≥5%)
🎯 4. LDL-C Targets Are Back
<100 mg/dL → Low/intermediate risk
<70 mg/dL → High risk
<55 mg/dL → Established ASCVD
👉 Shift: From % reduction → absolute target-driven therapy
🧬 5. Universal Lp(a) Testing
One-time Lp(a) measurement for ALL patients is now recommended.
≥125 nmol/L → ↑ ASCVD risk
≥250 nmol/L → ~2× risk
≥430 nmol/L → ~4× risk
👉 Intensify LDL lowering even if Lp(a) cannot yet be directly treated
🧪 6. ApoB & CAC — Precision Risk Tools
ApoB reflects total atherogenic particle burden and helps detect residual risk.
CAC score acts as “tiebreaker” in borderline/intermediate risk.
⚠️ 7. Expanded Risk Enhancers
Now includes:
PCOS, early menopause, adverse pregnancy outcomes
South Asian and Filipino ethnicity
CKM syndrome, inflammation markers
👉 Clinical message: Take detailed reproductive & ethnic history seriously
🩺 8. Special Populations – Stronger Statin Mandate
All patients (40–75 yrs) with:
CKD stage 3–4
HIV infection
→ Should receive statins irrespective of LDL-C
🍔 9. Triglycerides – Lifestyle First
Statins remain foundational even in hypertriglyceridemia.
Refer to dietitians if TG ≥150–1000 mg/dL with CKM features.
💊 10. Supplements – Clear Negative Recommendation
Non-prescription supplements (e.g., fish oil) are NOT recommended for ASCVD risk reduction due to lack of benefit.
🔥 CME INDIA Take-Home Messages
Atherosclerosis begins early → intervene early
LDL exposure = cumulative toxin → duration matters as much as level
Lp(a) is now a universal risk marker, not optional
Risk assessment is shifting from short-term to lifetime biology
Precision lipidology = LDL-C + ApoB + Lp(a) + CAC
🏷️
“From numbers to lifetime exposure: Lipidology has entered the era of precision prevention.”
https://t.co/HU2Fcucaf3