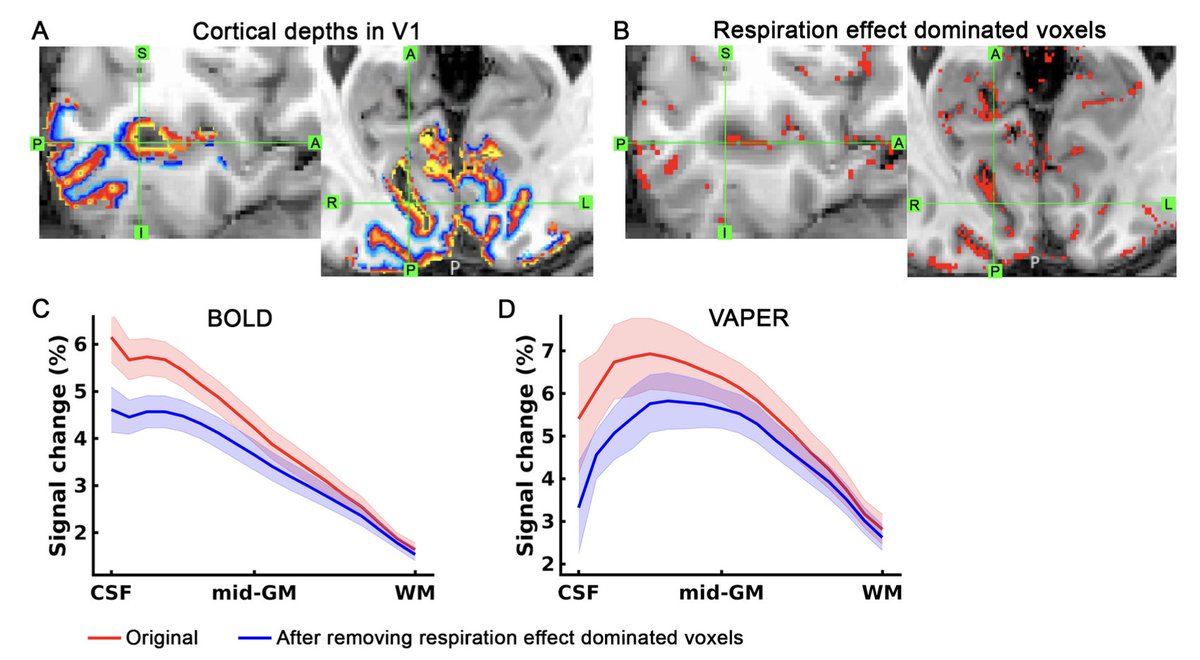
New layer-fMRI paper proposes how to reduce vascular biases by means of using respiratory signals.
By Yuhui Chai (@mripku) et al.
https://t.co/3fJz9PNuIW
After a high dose of psilocybin, the brain desynchronizes at a massive scale, causing loss of our sense of self, time, and space. This may drive the burst of plasticity caused by psychedelics. The next day, brain activity has largely returned to normal, but an echo remains – a reset of circuits critical to the sense of self.
Our study is out today in @Nature https://t.co/PjACA6nkAy
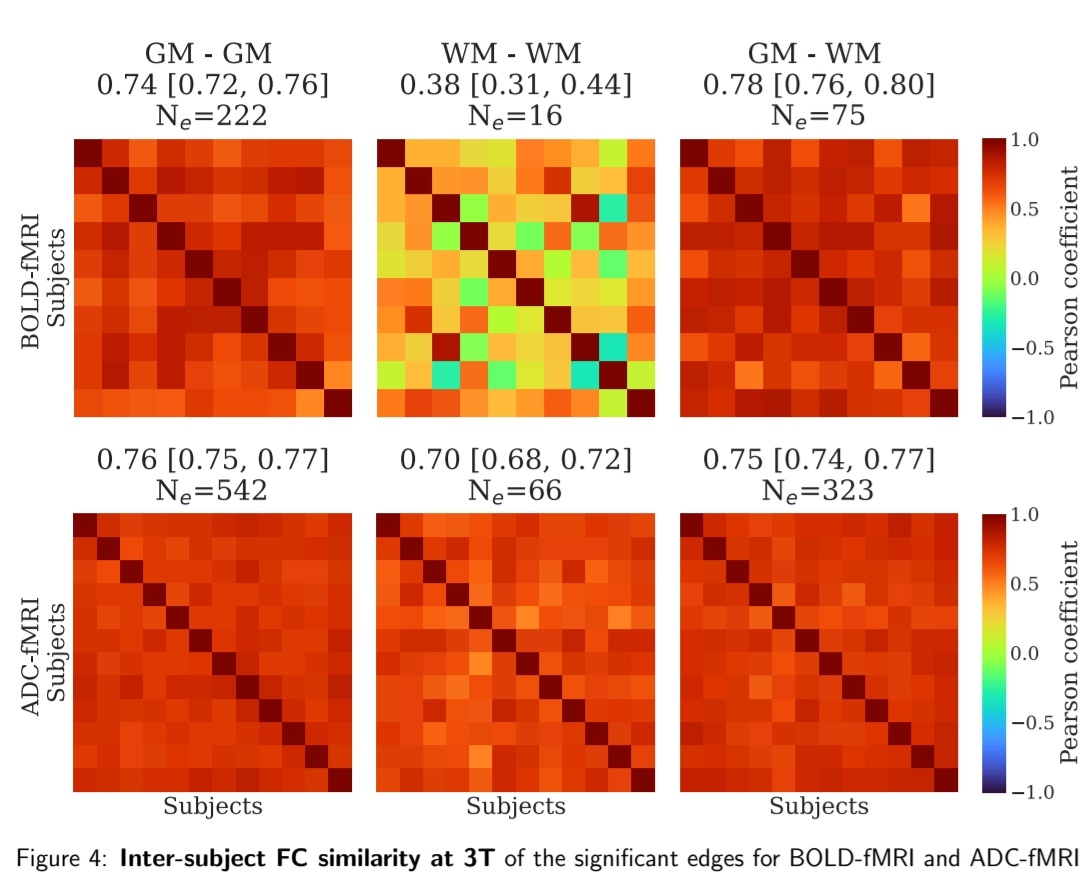
Do you use surface fMRI? We found spurious correlations in surface fMRI, with potentially serious implications for test-retest reliability, fingerprinting, functional parcellations and brain-behaviour associations (1/n)
https://t.co/Sv98S53P7x
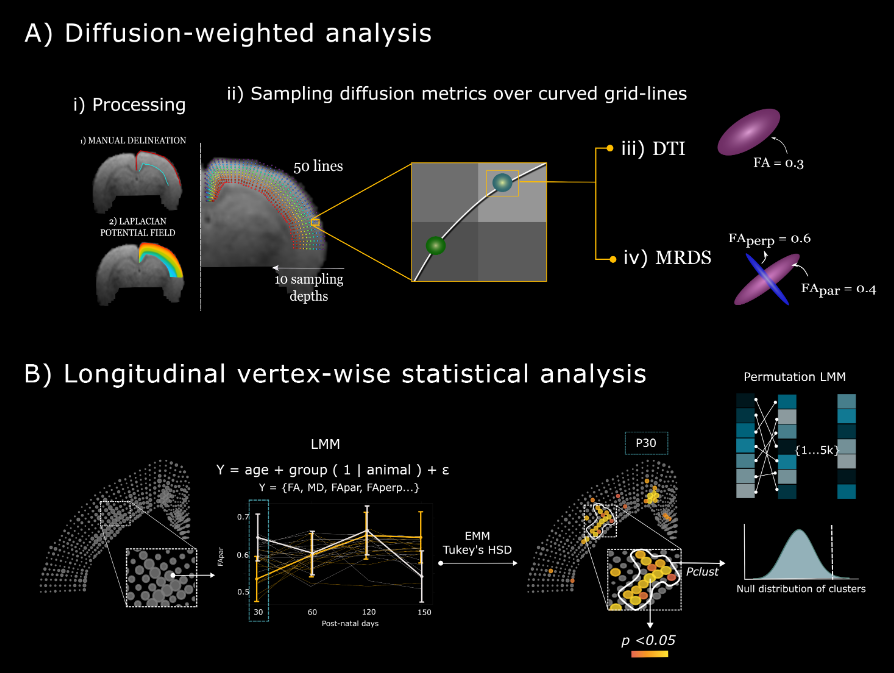
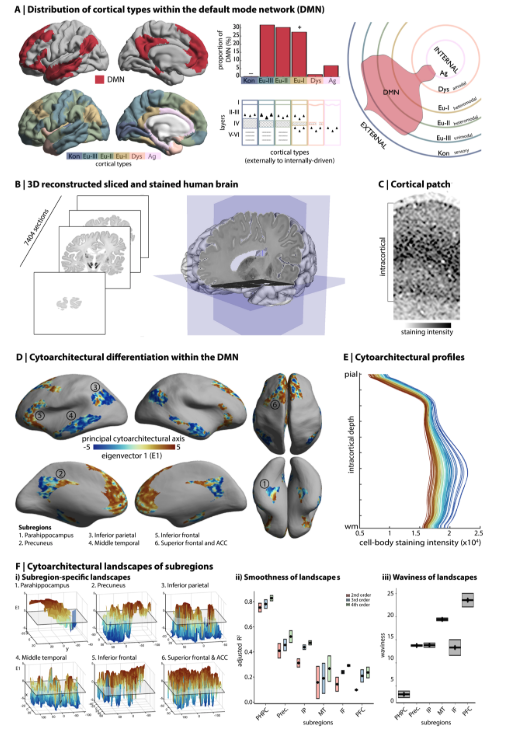
@PJ_Villasenor and team @UNAMINB use #diffusion MRI to characterize the microstructure of the cerebral cortex, and explain how it can be used to detect abnormalities that occur in neurological disorders, such as #epilepsy. https://t.co/YP7uYcxe60
We have labeled the right hemisphere of the 100-micron MRI scan released by Edlow et al and will be making it publicly available soon. Stay tuned!
Here's a video flying over axial slices:
https://t.co/SRvofeH8xz
Linear Regression is one of the most important tools in a Data Scientist's toolbox. Here's everything you need to know in 3 minutes.
1. OLS regression aims to find the best-fitting linear equation that describes the relationship between the dependent variable (often denoted as Y) and independent variables (denoted as X1, X2, ..., Xn).
2. OLS does this by minimizing the sum of the squares of the differences between the observed dependent variable values and those predicted by the linear model. These differences are called "residuals."
3. "Best fit" in the context of OLS means that the sum of the squares of the residuals is as small as possible. Mathematically, it's about finding the values of β0, β1, ..., βn that minimize this sum.
4. Slopes (β1, β2, ..., βn): These coefficients represent the change in the dependent variable for a one-unit change in the corresponding independent variable, holding other variables constant.
5. R-squared (R²): This statistic measures the proportion of variance in the dependent variable that is predictable from the independent variables. It ranges from 0 to 1, with higher values indicating a better fit of the model to the data.
6. t-Statistics and p-Values: For each coefficient, the t-statistic and its associated p-value test the null hypothesis that the coefficient is equal to zero (no effect). A small p-value (< 0.05) suggests that you can reject the null hypothesis.
7. Confidence Intervals: These intervals provide a range of plausible values for each coefficient (usually at the 95% confidence level).
There you have it- my top 7 concepts on Linear Regression. The next problem you'll face is how to apply data science to business.
I'd like to help.
I’ve spent 100 hours consolidating my learnings into a free 5-day course, How to Solve Business Problems with Data Science. It comes with:
300+ lines of R and Python code
5 bonus trainings
2 systematic frameworks
1 complete roadmap to avoid mistakes and start solving business problems with data science, TODAY.
👉 Here it is for free: https://t.co/YXG4pL97ZN
New paper in Imaging Neuroscience by Frederik J. Lange, Jesper L. R. Andersson, et al:
MMORF—FSL’s MultiMOdal Registration Framework
https://t.co/q2Z0AwSnvB
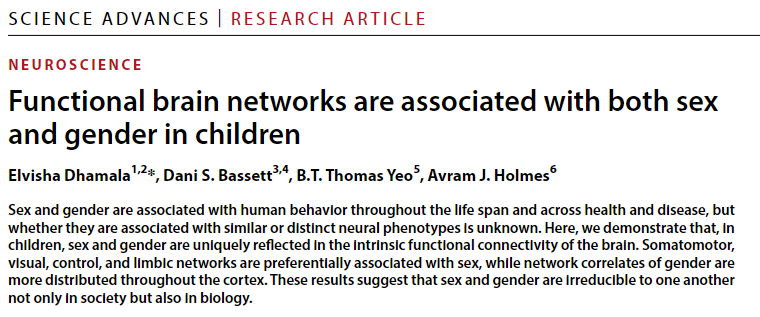
These findings are from a study in @ScienceAdvances which used data from 4,800 children to evaluate associations between functional brain networks, binary assigned sex at birth, and gender along a continuum. https://t.co/epVNLEmZyh 2/11
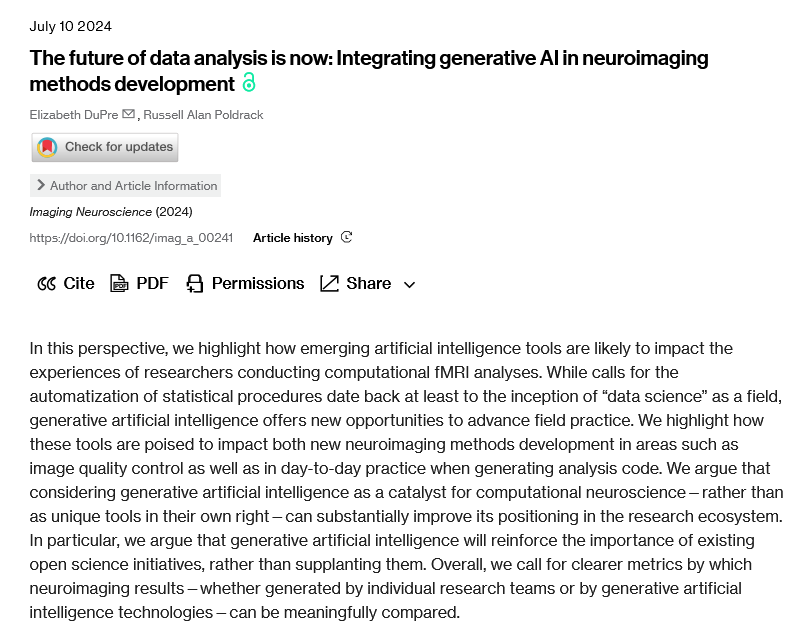
The future of data analysis is now: data science and generative AI in neuroimaging methods development https://t.co/T8UWFTqYVv From @emdupre_ and @russpoldrack "Most researchers lack necessary data science training"
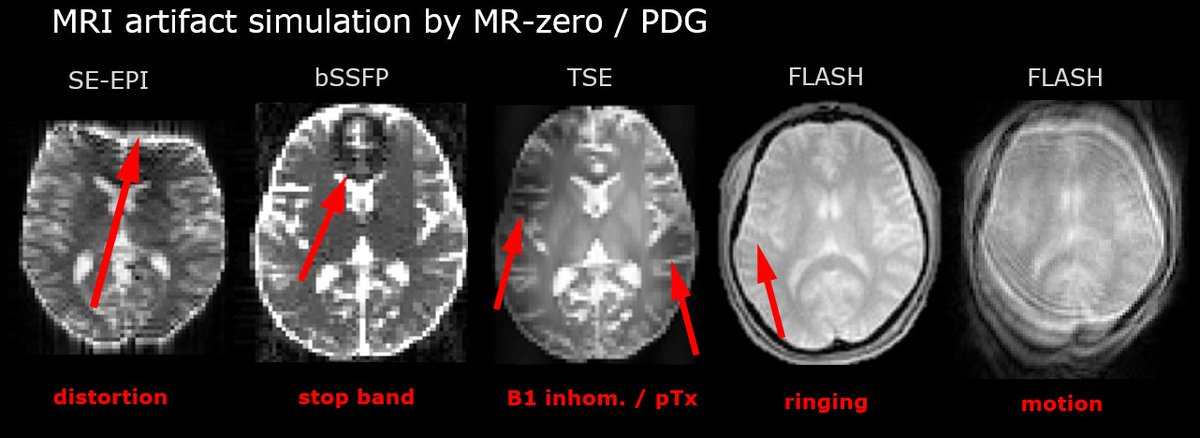
Nice MR images are actually easier to simulate than not-so-nice ones. MR-zero with Phase Distribution Graphs simulates typical MRI artifacts quite well, which helps to study and mitigate them.
https://t.co/K00md0jHJf
PDG: https://t.co/t2X79yFRXE
Interested in using miniscopes for imaging brain activity in awake, freely moving animals? Check out the #opensource large-field-of-view miniscope from the Aharoni lab in this week's post on OpenBehavior. @DanielBAharoni
https://t.co/fIW5X6XMkA