@DanyParlante Prueba con data.table::fread(). Igual y te ayuda a hacer algunos Guess sobre cómo leer los datos. c: Sino, pues cargarlos por tabs o por espacios y puedes utilizar tidyr::separate() después para separar esas columnas restantes. ✨🤔
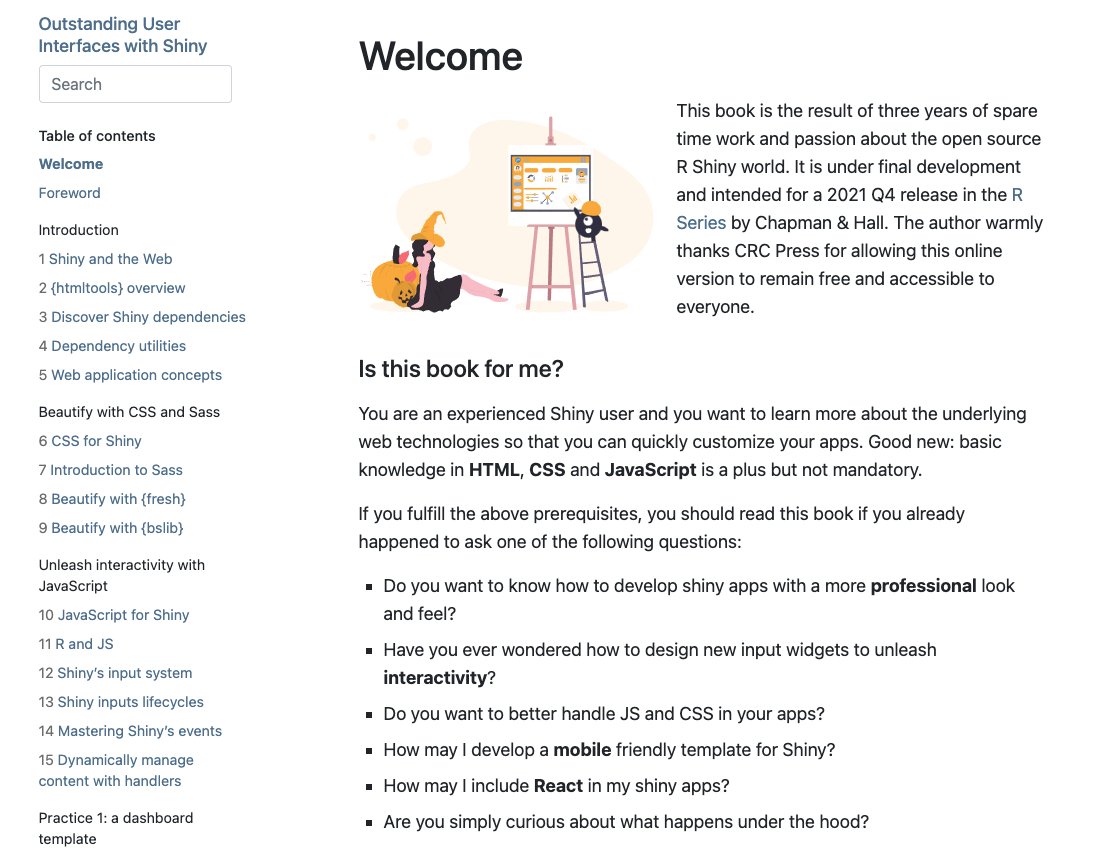
Hi #RStats . 💅Added a cover for the Outstanding user Interfaces with Shiny book. Many thanks to https://t.co/DbjCvnE3LS and @NinaLimpi for providing the building blocks. Saved me a month of work 😂. I also reworked the {reactR} chapter: https://t.co/CeEqdSkH7t. Feedback welcome!
I try and share the R code that produces all of the graphs that I post on here alongside each graph.
I was wary at first, but it's turned out to be an *excellent* decision.
Here's why and why I think you should do the same:
For this week's #TidyTuesday data I decided to learn how to use @Highcharts with R to explore reasons for CEO departures. 🧐
In turn, I decided to inaugurate my blog with a post about it. 🥳✨
Blog post with code: https://t.co/AXxuUEIGsI
#RStats#dataviz#DataScience