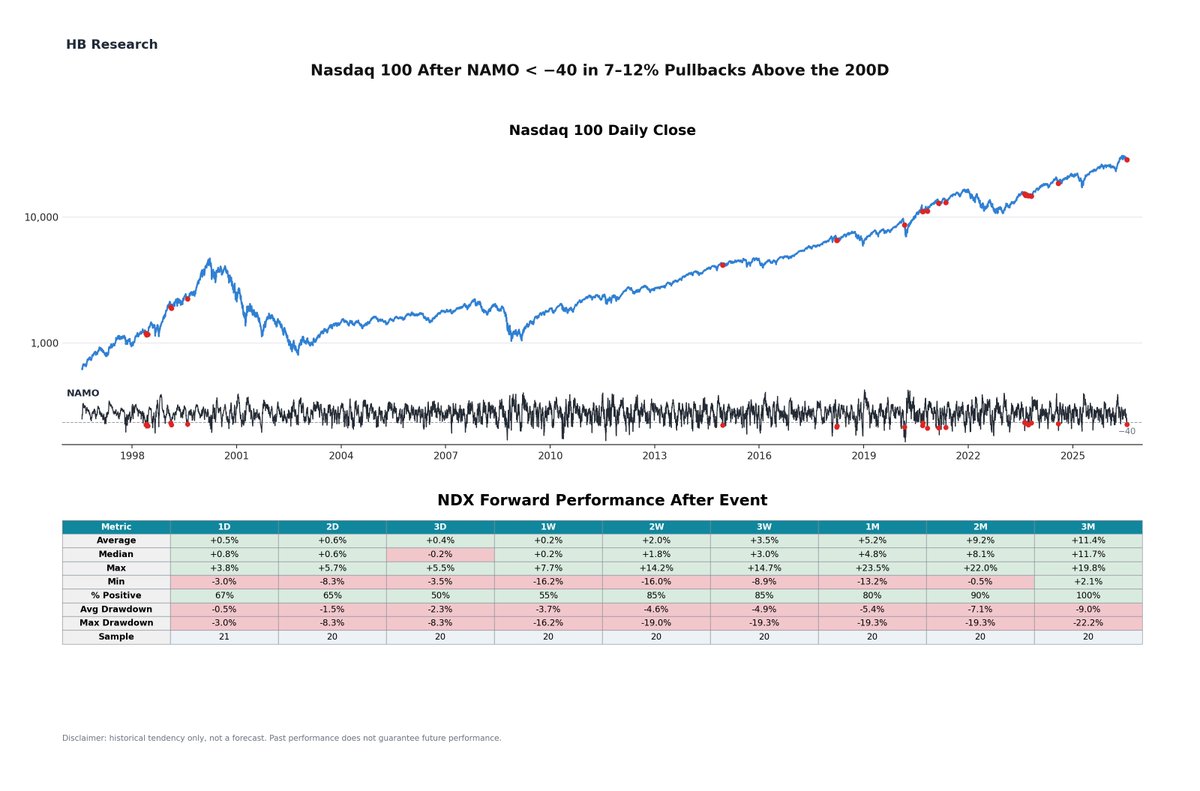
Tech is down hard, but the broad market still looks healthy.
With Nasdaq 8–12% below ATH, while the S&P is only 2–3% below and its 50D is rising, the sell-off has historically been tech-specific.
Nasdaq was higher every time 2M and 3M later:
+8.6% and +9.9% on average (n=17).
@bobmenr This drop is basically the only one of its magnitude. I could lower the threshold to a 13–15% monthly drop, but I don’t think that would be very constructive.
i've those stats from yesterday: https://t.co/vzCh8iq0Kk
Crazy momentum selling just won’t stop.
The PTF (a US tech-momentum ETF) has dropped more than 9% in just two days, for the second time since this correction began.
Crazy momentum selling just won’t stop.
The PTF (a US tech-momentum ETF) has dropped more than 9% in just two days, for the second time since this correction began.
The RSP/SPY 4D ratio ROC has again crossed above +2.2%, showing that the equal-weighted broader market is still intact and outperforming cap-weighted SPY.
Historically, the Nasdaq 100 has performed exceptionally well after these events.
(Small sample, SPX returns in comments)
11.7% median return is for 3 months, not 12.
Across all Nasdaq days, the equivalent random-sample median is just +4.7%; the joint result occurs with p=0.0002.
A regime-matched placebo test using 10,718 random samples shows a +9.1% median 3M return, versus +12.5% after this setup; the joint median and win-rate result has a p-value of 0.026. After reducing the 20 signals to 14 independent episodes.
Nasdaq is only ~8.6% below its all-time high, yet NAMO has crossed below −40.
After 7–12% pullbacks from ATH, while Nasdaq stays at least 3% above its 200D, it was higher every time three months later, +11.7% median (n=20).
(7-10% version in comments)