How famous creatives organize their day?
I made a #dataviz on @tableaupublic showing daily routines of some of the greatest mind/creatives. It turned out there's no real recipe for success.
Link: https://t.co/IYh09X4N8J
#tableau#DataFam
It was hectic last week for me and I missed the announcement of Featured Author. I’m beyond happy and graceful that I MADE IN THE LIST!!!. And thank to @tableaupublic for keeping my pun #punsforlife
"I love discovering insights...for organizations and weaving compelling stories from data that even non-technical audiences can easily understand.” @nicolemark_ one of the amazing women in this Featured Authors Women's Edition. Meet them all here. https://t.co/hlMGvnmUmo
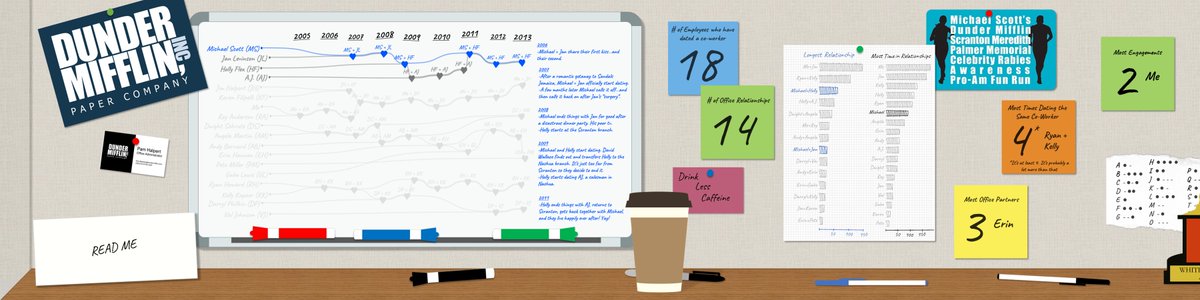
🚨New Viz: Office Relationships
I admit, this one is a little ridiculous but I had so much fun building it.
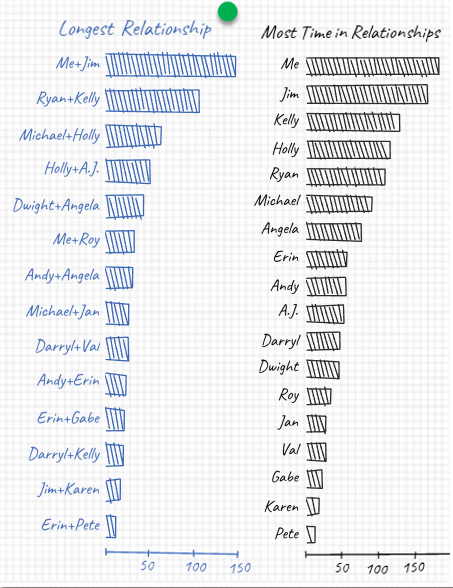
Check out Pam's "hand-drawn" data viz, exploring all of the office romances at Dunder Mifflin Scranton. Link to interactive viz below
https://t.co/BWyQpFborI
For #IronQuest Re-Viz-It (late again), I re-did my #StopAAPIHate viz, using new data. Last Wed (03/16) marked the 1-yr anniversary of the Atlanta shootings. I did the 1st one b/c I couldn't focus for days afterwards. A year later, same...
Interactive viz: https://t.co/VpPlNVwXO3
My spin on the @tableau Call Center accelerator dash for #RWFD challenge by @MarkBradbourne
Had fun with this one so let me know what you think!
🔗 https://t.co/4YKHAZeVXq
Honestly would spend four hours a day diving into all the beautiful visualizations on @TableauPublic if I had the time. Today's stunner was this map by @ZachBowders. Sometimes simple is perfection. https://t.co/1PKFqrFfnv
In this #VOTD, @SParsonsDataViz analyzes Superstore data to quickly spot which brands are underperforming and decide if they should be promoted or simply removed from inventory. https://t.co/zXfGBmvSwl
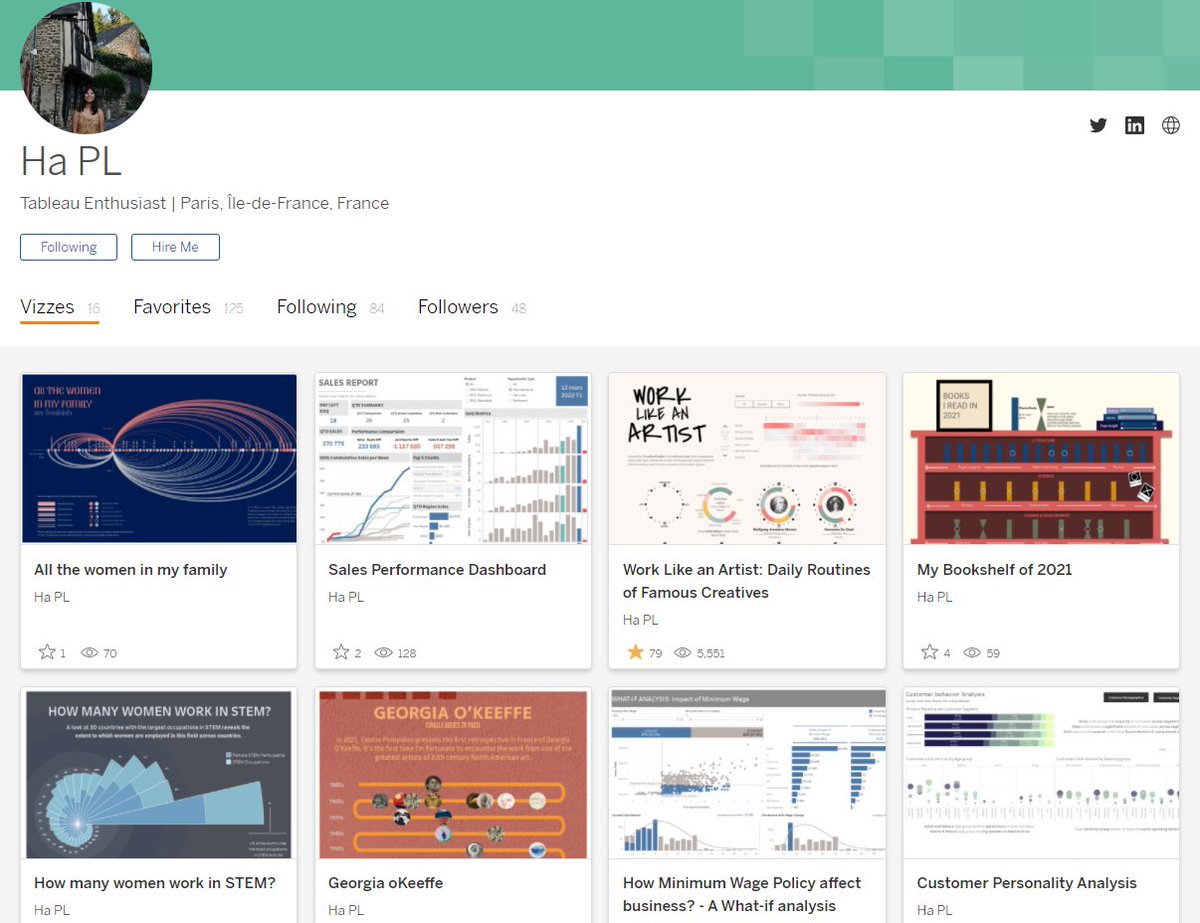
My second #TableauFF this week is @HaPhamLy!
Ha has a beautiful @tableaupublic portfolio full of unique, eye-catching designs. Ha was also featured as #VOTD earlier this week!
Follow here: https://t.co/gUsPEedsBK
Friday is over but my late #TableauFF is @HaPhamLy, who just got #VOTD a few days ago with her viz "Work Like An Artist"! I'm excited to see a fellow Vietnamese's profile with an interesting mix of art, business and personal topics!
Give her a follow:
https://t.co/5cA3Jv0KrL
The clever people at @NASA have created this deceptively simple yet highly effective data visualisation showing monthly global temperatures between 1880-2021. Watch until the end...
Learn more here - https://t.co/yvLKEgcIZ7
#ClimateEmergency#ClimateCrisis#climate
Here's my humble attempt at replicating & adapting the data viz stylings of W.E.B. Du Bois to look at Canada's Black population. Inspired by @menscuriosa's work. Feedback please!
Interactive viz: https://t.co/8sXhAik8bb
#DuBoisChallenge2022#DiversityinData#BlackHistoryMonth
@sarahlovesdata@tableaupublic Thank you Sarah! This is such a lovely Friday surprise! I would love to take credit of the unique part but I just got a lot of inspirations/ ideas from #datafam 😅