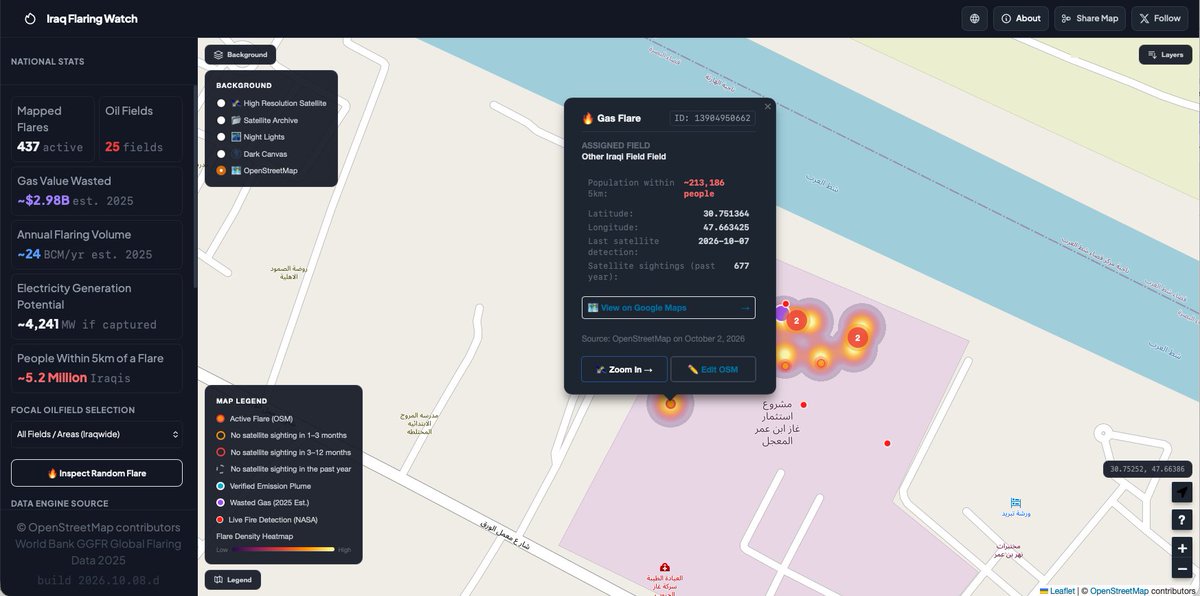
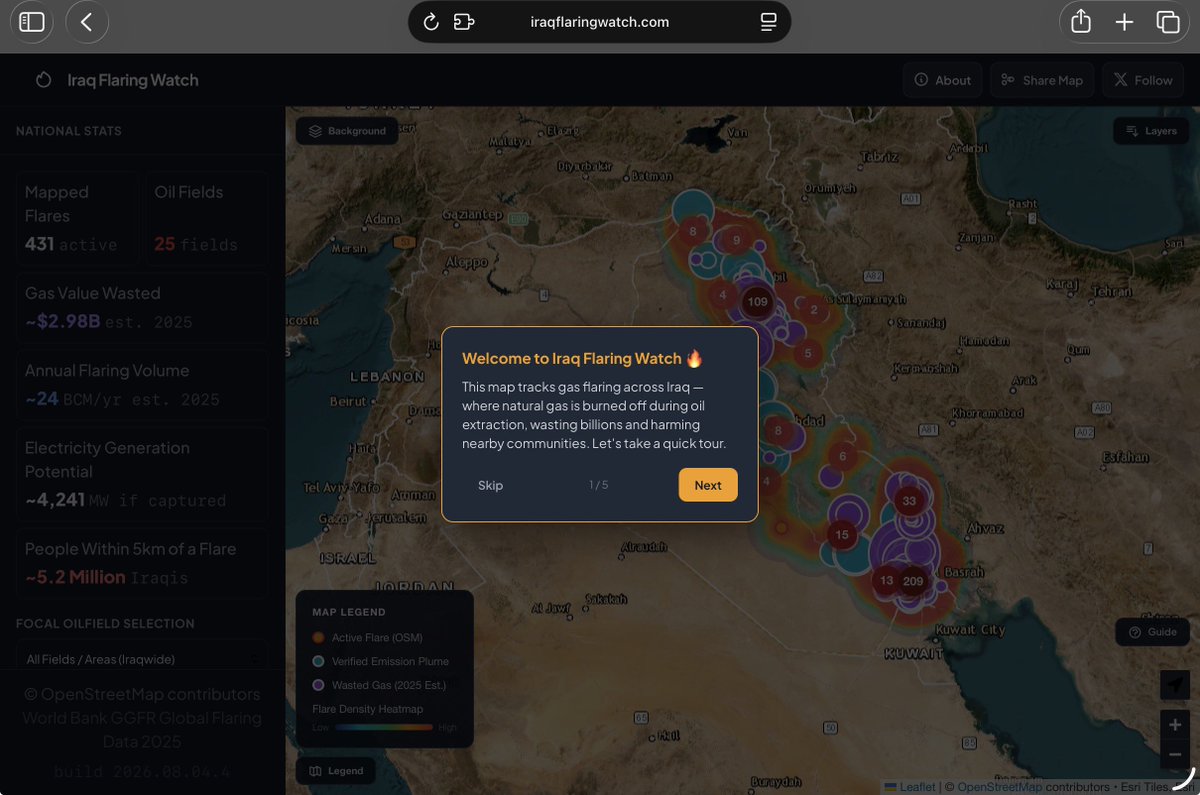
Iraq Flaring Watch🔥 — interactive map tracking gas flaring,
emission plumes, and gas waste across Iraq.
🟠 Active flare sites
🟣 USD value wasted annually
🔵 Satellite-detected emissions
https://t.co/kHpEUyh9xS
چاودێری مەشخەڵی گازەکانی عێراق ئێستا بە زمانی کوردی بەردەستە
@IraqFlaring now supports Sorani Kurdish... we thank
@WeblateOrg for their generous support.
https://t.co/bHPLWFxl2q
So how many of Iraq's 437 mapped flares are actually burning? 🔥🛰️
Last 12 months of VIIRS satellite data: 🟠 372 (85%) active — seen in the last 30 days 🟡 9 — last seen 1–3 months ago 🔴 22 — last seen 3–12 months ago ⚪️ 34 (8%) — not detected at all this year
Major update to Iraq Flaring Watch 🔥🛰️
You can now see, for every gas flare, when it was last detected by satellite and how many times in the past year.
Left: Bazian Refinery — no flaring detected all year.
Right: Bin Omar Gas Field — last seen burning yesterday.
Major update to Iraq Flaring Watch 🔥🛰️
You can now see, for every gas flare, when it was last detected by satellite and how many times in the past year.
Left: Bazian Refinery — no flaring detected all year.
Right: Bin Omar Gas Field — last seen burning yesterday.
Iraq's flaring fell sharply after 2017 — then stalled completely. Five straight years (2021–2025) flat at ~24 BCM, despite every reduction pledge.
Watch Every Gas Flare in Iraq: https://t.co/Xql4TtogXd
The national picture 🔥
Every red square is a fire NASA's VIIRS satellite caught in the last 3 days. Every orange dot is a community-mapped flare. Where they overlap, you're seeing the same wasted gas confirmed by two independent sources.
https://t.co/xJxrWlIseh
Major upgrade to Iraq Flaring Watch 🔥
We've added near real-time VIIRS thermal hotspot detections from @NASA as a new map layer — letting anyone independently verify where flaring is happening right now.
Satellite-detected fire, updated every few days:
https://t.co/lhgMBzYhXZ
We have improved our user experience substantially making the satellite background more easy to navigate and including a user guide for first time visitors to be able to reach a wider audience.
https://t.co/Xql4TtogXd
Iraq imported 6 BCM of gas from Iran in 2025 to keep the lights on — while burning 24 BCM into the atmosphere 🔥
That's 4x what it imported, flared and wasted.
Source: @WBG_Energy Global Gas Flaring Tracker 2026
See every flare site in Iraq 👇
https://t.co/E5zaRiqFSI
Global #gasflaring hit 167 billion cubic meters (bcm) in 2025, the highest level since 2019 &the third consecutive annual increase. Oil production grew 3.3%, but flaring grew faster. The trend is moving in the wrong direction, undermining energy security.
https://t.co/T2laM2bsPv
Kirkuk — where Iraq's oil story began over a century ago 🔥 The flares around Baba Gurgur field have burned for decades. The 5km impact zones reach the city, the airport, the villages.
https://t.co/iNLRfddbWz
This is what gas flaring looks like from above in Basra 🔥 Every glowing dot is an active flare. Every red circle is the 5km zone where residents breathe the smoke.
https://t.co/HifhktDYRJ
Every red circle = 5km around an active gas flare 🔥
This is Basra — Iraq's oil capital.
~5.1 Million Iraqis live inside one of these circles nationally.
Toggle the 5km layer yourself 👇
https://t.co/KW33Ao4QbT
@agailani90 “While Iraq pays a premium for unreliable imported gas (around $8 per MMBtu), it flares a domestic resource that could be captured and processed for an estimated cost of around $2 per MMBtu, representing a potential lost revenue exceeding $1 billion”
https://t.co/JnGcpfPxbT
Iraq Flaring Watch just got smarter 🔥
~5.1 Million Iraqis live within 5km of an active gas flare
~$2.25B in gas value burned annually
~3,196 MW of electricity generation potential — wasted
Explore the map 👇
https://t.co/kHpEUyh9xS
@agailani90 $3.5 per mmbtu is the assumed price.
That’s the minimum price the government has decided to charge for natural gas.
Source:
https://t.co/Zwvm5iftjs
558,831 people live within 5km of this gas flare in Baghdad 🔥
The streets, the river, the neighbourhoods — all within
5km distance of an active industrial flare.
https://t.co/t4fWnX0APL
The largest CO2 emission plume detected in Iraq by satellite 🛰️
1,815,622 kg/hr — detected over the Rumaila oil field on
25 December 2025 by @CarbonMapper.
Click the cyan dot to see the satellite detection image 👇
https://t.co/mjtzeL06Kg
LUKOIL's West Qurna 2 field flared 1,642 million m³ of gas in 2024 🔥
That's ~$202M USD in value burned into the atmosphere —
enough electricity to power ~1.6 million Iraqi homes for a year.
Click the purple bubble 👇
https://t.co/8zdWnImKME