before you take an IB reversal on $YM today, look at this…
over the last 6 months in the NY session, the 60min IB by weekday report shows this for Mondays:
→ single break: 73.08% of the time
→ double break: just 26.92% of the time
takeaway:
IB high breaks = look for continuation longs, not a reversal to the IB low
IB low breaks = look for continuation shorts, not a reversal to the IB high
19 of the last 26 Mondays, $YM broke only one side of the initial balance.
if you trade the overnight high and low on $NQ, you need to know this stat:
over the last 6 months in the NY session, the overnight range breakout report shows these stats:
→ single break: 75.38% of the time
→ double break: just 10.77% of the time
takeaway:
overnight high breaks = look for continuation longs, not a reversal to the overnight low
overnight low breaks = look for continuation shorts, not a reversal to the overnight high
roughly 3 out of 4 sessions, $NQ broke only one side of the overnight range.
Took this trade on $ES this morning. swept the lows into a 4H imbalance, retest long, out at the previous day’s high.
The entry was my model. The target came from the previous days range report on @edgeful
→ previous day’s high gets broken 57% of days
→ and when it breaks, the day closes green 67% of the time
When price is in a bullish daily fair value gap and the previous day's high hasn't been run, this is an A+ setup for me.
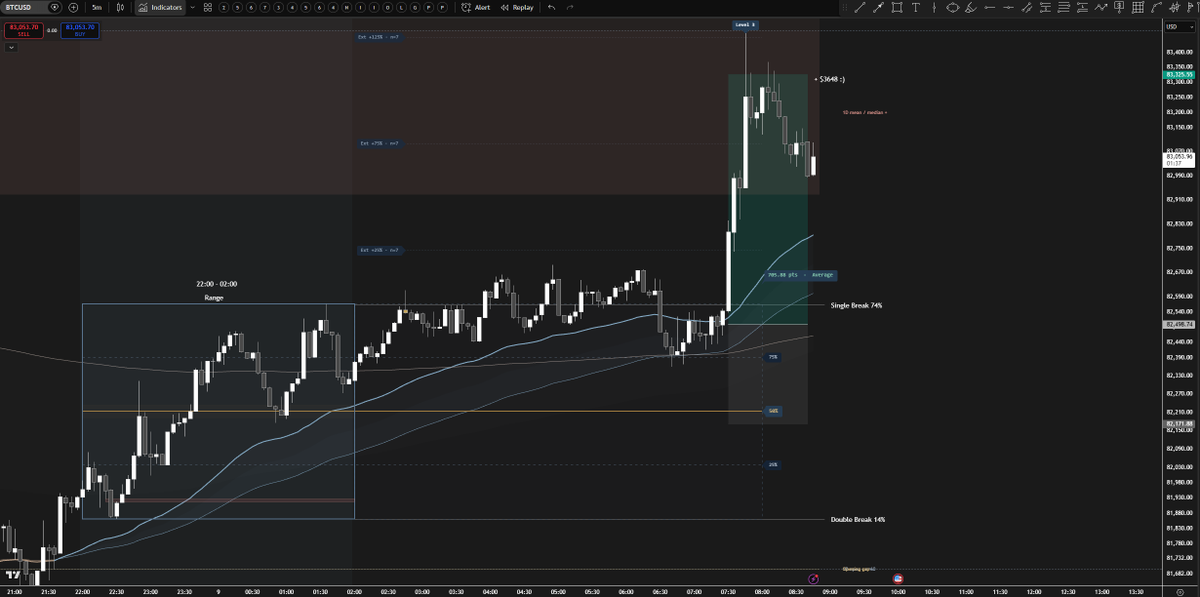
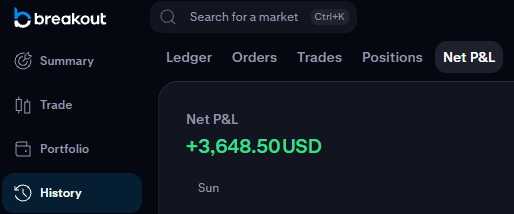
+$3,648 on $BTC this morning, all from one simple setup.
The 22:00–02:00 range is insanely good right now.
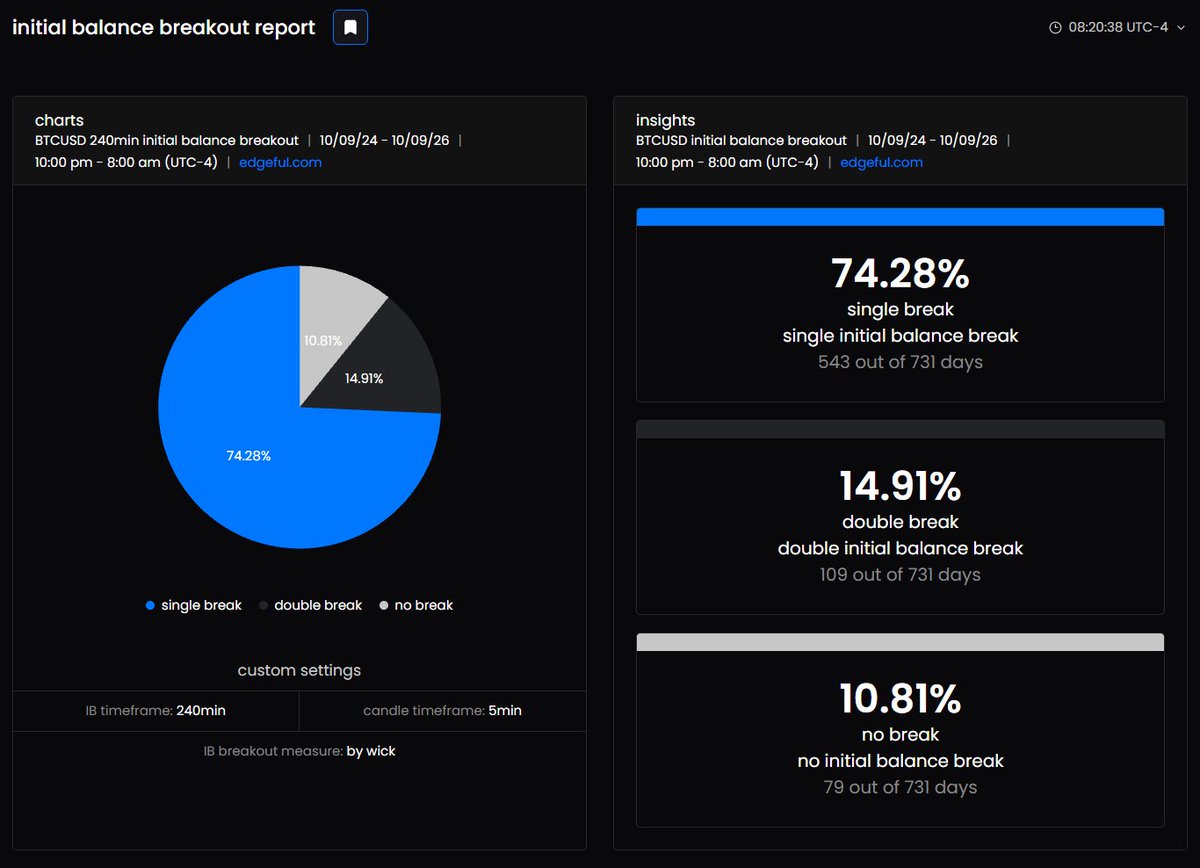
$BTC breaks a single side of the range, 74% of the time.
Here's how I traded it this morning:
- Price breaks above the 22:00–02:00 range high
- Wait for pullback and only look for longs
- Entry at the pullback to 75% and MA
In and out in just 25 minutes.
Data: @edgeful
Most traders mark Midnight Open.
Almost nobody studies what may be the more important reference point:
The midpoint of the entire midnight candle.
I analyzed the hourly overnight structure on NQ.
The midpoint of the 00:00–01:00 AM ET candle was revisited during the 08:00 AM–04:00 PM ET window in:
NQ: 73.5% of sessions
Read that again.
This is NOT the Midnight Open price.
It is the 50% level of the full 00:00–01:00 AM ET candle range.
Midnight Open gives you one reference point.
The midnight candle gives you an entire structure:
• High
• Low
• Midpoint
And that midpoint may act as a high-probability intraday draw more often than most traders assume.
Most traders look for another entry model.
Sometimes the better edge is simply understanding which overnight levels price is statistically likely to revisit.
Source: Own NQ futures study
Data period: 2015-2025
Do you track only Midnight Open, or the full midnight candle structure?
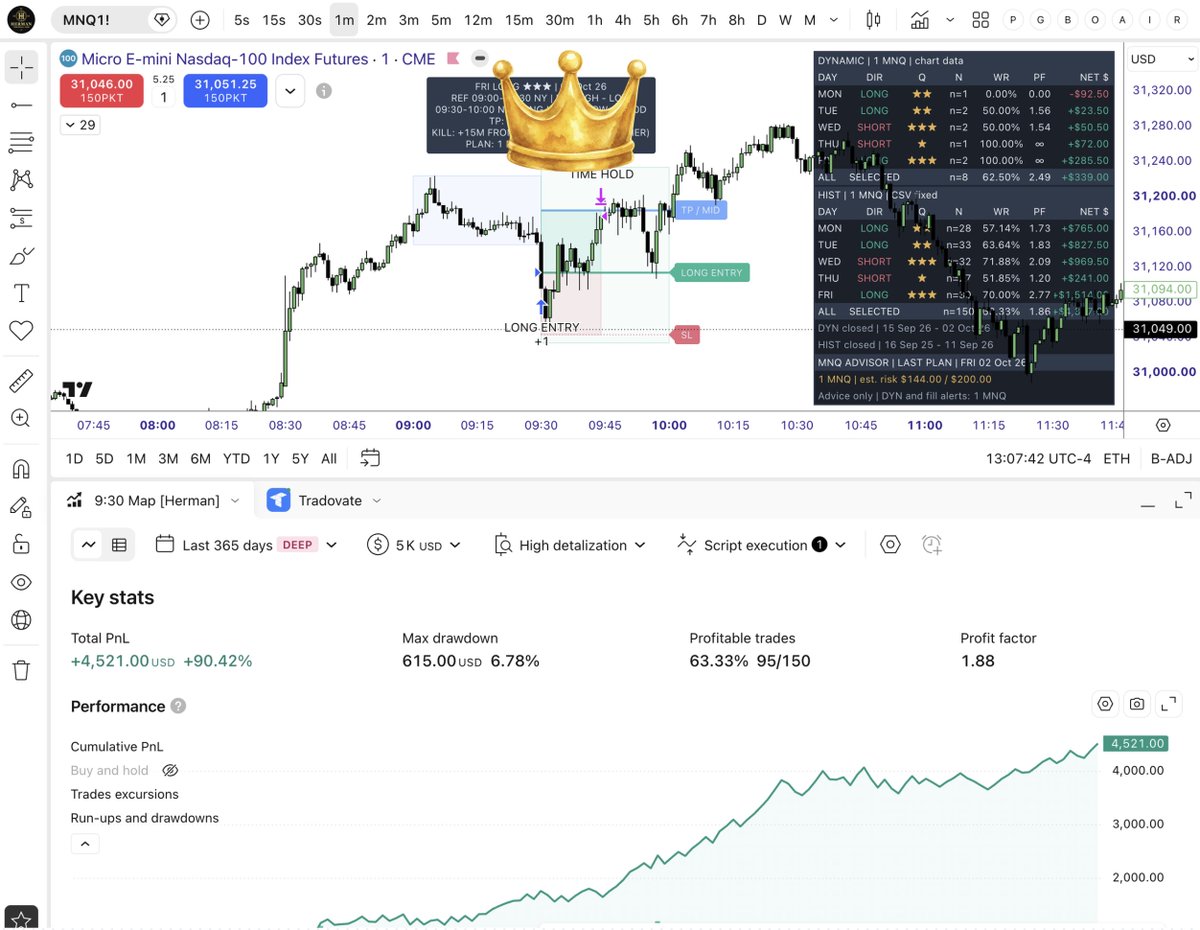
9:30 AM NY has a 63.3% WIN RATE with a completely mechanical 1R strategy.
No discretion. No prediction.
Just ONE rule-set built around the day of the week:
MON → LONG only
TUE → LONG only
WED → SHORT only
THU → SHORT only
FRI → LONG only
1-year MNQ backtest:
• 150 trades
• 63.33% win rate
• 1.88 Profit Factor
• +90.42% return
• +$4,521 on a $5K account
• 6.78% max drawdown
100% mechanical.
The only thing changing is which direction I'm allowed to trade at 9:30 AM NY.
Sometimes the simplest probabilities are the hardest to ignore.
Would you trade a model this simple?
Same box. Same hour. Brand new week.
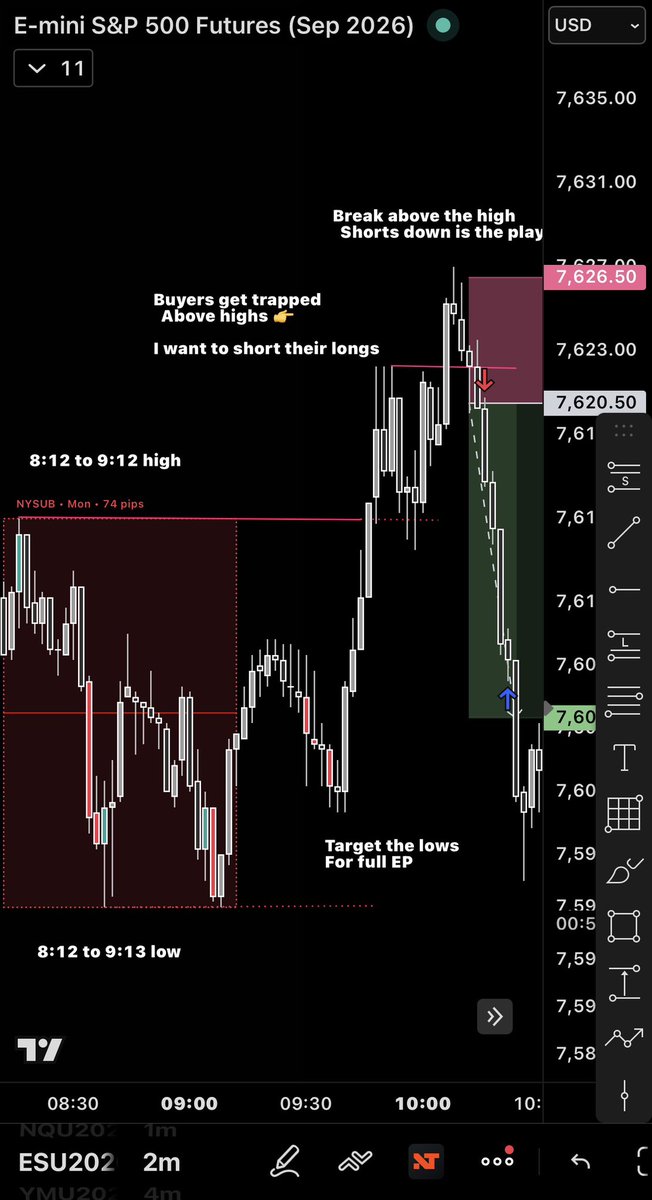
Every morning, 8:12–9:12 builds a range. More often than not, price goes on to take both the high and the low of it.
76%. 66%. 66%. 70%. 70%.
Here's how NQ played out from Mon 28th Sept to Fri 2nd Oct 🧵
TradingView might be going out of business
The open-source TradingView Premium version is currently the #6 trending repository on GitHub, with 971 stars today
The devs also announced that the project and repo are going private
The version is available for Windows and Mac, with GitHub and Discord links in the "Community" section of the app
The true power of open-source
If you struggle with 9:30 open just test this out:
>mark the 8:12 to 9:12 high and low
> market to break one side
> look for plays for opposing end
If you like trading reversals this is the cheat code you have been looking for.
↓
• If $NQ breaks yesterday’s high, there’s a 74% chance we close green.
This has happened 116 out of 155 times over the past year.
• If $NQ breaks yesterday’s low, there’s a 64% chance we close Red.
This has happened 68 out of 107 times over the past year.
Use this to help understand your daily bias and where price is likely to move.
This report by @edgeful pulls data from the past year on $NQ to show how the daily candle tends to close whenever the previous day’s high or low gets broken.